

An experiment in Nigeria suggests that business plan competitions can effectively identify entrepreneurs capable of utilising capital to spur growth
Most firms in developing countries have very few workers. For example, Hsieh and Olken (2014: 93) report that in India and Indonesia “the fraction of firms with less than ten workers is almost visually indistinguishable from 100%.” In Nigeria, survey data indicate that 99.6% of firms have fewer than ten workers. Are there potential entrepreneurs out there with the ability to grow firms beyond this ten worker threshold, and, if so, how can they be identified and helped by public policy?
Business plan competitions are starting to become a popular tool to foster high growth entrepreneurship. After starting in the US, they now exist in many developing countries and are being used by World Bank-supported programs in several Sub-Saharan African countries, including Côte d’Ivoire, Gabon, Guinea-Bissau, Rwanda, Senegal, Somalia, South Sudan, Tanzania, and Uganda. In a recent article, I evaluate the impact of one of the largest such competitions, the Youth Enterprise With Innovation in Nigeria (YouWiN!) program (McKenzie forthcoming).
The competition
YouWiN! is a business plan competition for young entrepreneurs in Nigeria. It had the stated objective of encouraging innovation and job creation through the creation of new businesses and expansion of existing businesses, and was launched by the President of Nigeria in October 2011. There have been three completed rounds of the program. I evaluate the impact of the first time the competition was run. In the first year, 23,844 applications were received, with the top 6,000 getting selected to receive a four-day business plan training course. 4,510 business plan applications were received and scored, and 1,200 winners were selected to receive prizes averaging US$50,000 each.
Impact evaluation design and data
The top 300 scores were chosen as national winners, and 180 winners were then chosen as top in their respective regions. Then for reasons of fairness, operational practicality, and to enable a rigorous impact evaluation, the remaining 720 winners were chosen randomly from a pool of 1,841 semi-finalists. The impact evaluation uses this randomised experiment to compare winners to this control group.
Four rounds of annual follow-up surveys were taken one, two, three, and five years after the application. The last follow-up took place in 2016, when Nigeria was experiencing its worst economic performance in 30 years, driven by a contraction in the oil sector.
Results: Impact on employment
I estimate results separately for those proposing to start new firms, and for those who applied with existing firms that they wanted to expand.
One of the principal objectives of the YouWiN! Program was job creation. Figure 1 shows that the average new firm applicant in the control group had created between three and four jobs, with this remaining relatively constant over time.[1] In contrast, in 2013 and 2014, the average new firm applicant was employing nine workers after winning. This has fallen to 6.4 workers in 2016, which is still 2.6 workers more per firm than in the control group.
Figure 1 Employment in treatment and control firms
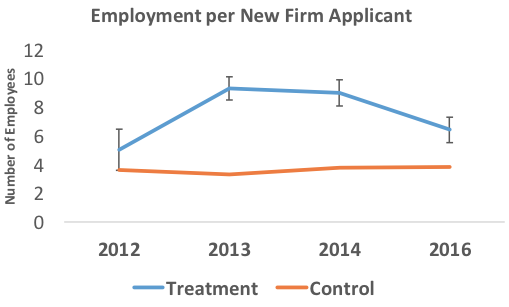
Figure 2 shows the program was successful in selecting the types of individuals who were more likely to generate firms that would reach ten or more workers than the average firm in the economy, with 11% of the control group having ten or more workers in 2014 and 12% in 2016. Winning results in a large increase in this likelihood—in 2014 new firms were 22.9 percentage points more likely to have more than ten employees as a result of winning. This has fallen in 2016 to an 11.1 percentage point effect, but this is still twice the likelihood of the control group having this many workers.
Figure 2 New firm applicants are more likely to have grown to 10+ workers after winning
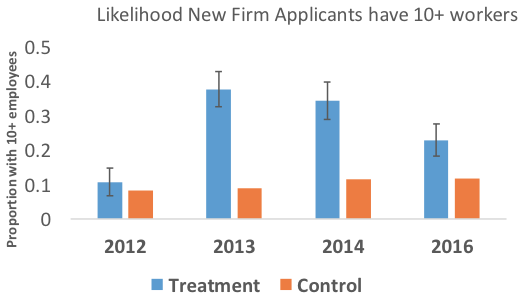
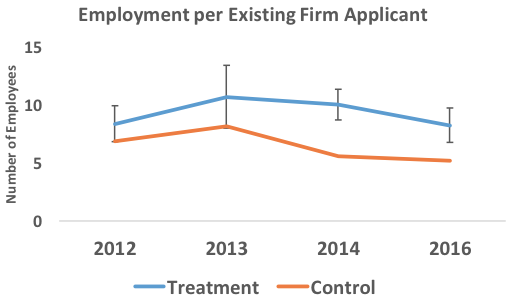
Figure 3 examines the analogous impacts on the number of workers employed for those individuals who applied with existing firms. The winners average 8.2 workers employed per applicant in 2016, compared to 10.0 in 2014. This represents a treatment effect of winning 3.0 workers, compared to 4.4 workers in 2014. These are again unconditional estimates, which code closed firms as having zero employees. Conditional on operating a firm, the treatment group has a mean of 9.6 and median of 7.0 workers, compared to a mean of 7.0 and median of 5.0 workers in the control group. As a result, the winning firms are still 13.1 percentage points more likely to have ten or more employees than the control group.
Figure 3 Existing firm applicants have more employees after winning
Based on these estimates, I calculate that the program has generated more than 7,000 new jobs by 2014, and that 4,200 of these jobs were still around in 2016, at a time when the economy was in recession.
How did winning the competition help firms to grow? The main impact appears to be through the funding enabling them to buy more physical capital, use more working capital, and hire more workers. There was little impact on business practices, use of mentoring, or business networks. Firms innovated, introducing new products to their local markets, and increased profits and sales as a result. The estimated return to capital is between 1.3 and 3.4% per month.
Despite their increasing popularity, evaluating the impact of business plan competitions has been difficult for at least two reasons. The first is that many competitions only choose a few winners, making sample sizes small. The second is that because competitions try to choose the best firms, comparing winners to non-winners likely involves substantial selection bias. The large-scale randomised experiment conducted here helps overcome both problems, and shows that business plan competitions can both identify the types of entrepreneurs who have the potential to use large amounts of capital, and to spur their growth beyond that which would have naturally occurred.
References
Hsieh, C-T and B Olken (2014), “The missing ‘Missing Middle’”, Journal of Economic Perspectives 28(3): 89-108.
McKenzie, D (Forthcoming) “Identifying and spurring high-growth entrepreneurship: Experimental evidence from a business plan competition”, American Economic Review, forthcoming.
Endnotes
[1] Note these numbers include those applicants who are not operating firms, who are coded as having zero workers. Conditional on a new firm applicant operating a firm, the control group has a median of 5 and mean of 7.7 workers employed in 2016, while the treatment group has a median of 7 and mean of 8.7 workers employed in 2016.