


Economic activity is concentrated in low-lying urban areas despite greater risk of flooding, and tends to return to these areas rather than relocating
Extreme rainfall during December 2015 resulted in widespread flooding across northern England, Scotland and Ireland. The cost of this particular period will potentially exceed $2 billion (Bounds 2015). An important policy question is therefore: Why are so many people hit by flooding, particularly in locations that are repeatedly inundated?
The recent events in the UK and Ireland are just one example of a major global problem. According to media reports collated by the Dartmouth Flood Observatory (2014), from 1985-2014 floods worldwide killed more than 500,000 people, displaced over 650,000,000 people, and caused damage in excess of $500 billion. Other datasets tell of even greater impacts – according to the International Disaster Database (EM-DAT, see Guha-Sapir et al. 2015), in 2010 alone 178 million people were affected by floods and total losses exceeded $40 billion. To these direct costs we should add longer-term costs due to the disruption of schools, increased health risks and disincentives to invest.
Imperative to understand
So it seems important to understand why so much is lost to floods. One might argue that the risks of floods are balanced by gains from living in flood-prone areas. But as Kydland and Prescott (1977) show, flood plains tend to be overpopulated, because the cost of building and maintaining flood defenses is often borne by governments and not by private developers. This problem is in fact worse than you might think, because the costs of flood recovery are also often borne by government and NGOs. This situation creates potential for misallocation of resources, and forces society to answer difficult distributional questions.
In a recent working paper (Kocornik-Mina et al. 2015), we examine how prevalent it is for economic activity to be concentrated in flood-prone areas, and whether cities adapt to major floods by relocating economic activity to safer areas.
Large-scale urban floods
In our empirical analysis we study the impact of large-scale urban floods. We use new data from spatially disaggregated inundation maps of 53 large floods, which took place from 2003-2008. Each of these floods displaced at least 100,000 people, and taken together the floods affected 1,868 cities in 40 countries around the globe, mostly in developing countries. Figure 1 shows the locations of the large flood events included in our analysis. We study the local economic impact of the floods using satellite images of night-lights at an annual frequency.
Figure 1. Map showing the locations of world’s cities, including those affected by our sample of large flood events
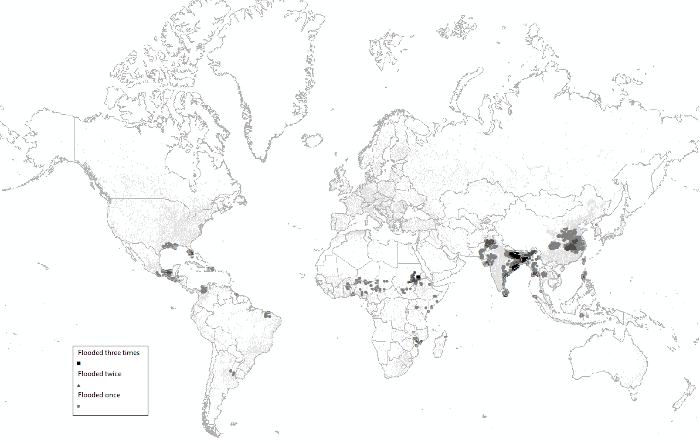
Notes: City sizes are inflated in order to make them visible on a map of the entire world. Smaller dots correspond to cities not affected by any of the floods in our sample. The number of floods in the legend refers to the number of years from 2003-2008 during which each city was affected by a flood that displaced a total of 100,000 people or more.
Our data show that the global exposure of urban areas to large-scale flooding is substantial, with low-lying urban areas flooded much more frequently. Globally, the average annual risk of a large flood hitting a city is about 1.3% for urban areas that are more than 10 metres above sea level, and 4.9% for urban areas at lower elevation. In other words, urban areas that are less than 10m above sea level face an average annual risk of about one in 20 of being hit by a large flood. Of course, this average masks considerable variation across locations. Local flooding risk results from a complex combination of local climate, permeation, and topography, among other factors. Some urban areas – even if located at low elevation – will flood rarely, if ever. At the other extreme, some urban areas flood repeatedly. In our sample, about 16% of the cities that are hit by large floods are flooded in multiple years.
We also find that even though low-lying areas are more likely to flooded, they concentrate a higher density of economic activity, as proxied by night-light intensity. This disproportionate concentration of economic activity in low elevation areas is found even for areas that are prone to extreme precipitation, where the risk of large scale flooding is highest.
When we analyse the local economic impact of large floods, we find that on average they reduce a city's economic activity as measured by night time lights by between 2% and 8% in the year of the flood. Recovery, however, is relatively quick – lights typically recover fully within a year of a major flood, even in the hardest hit low-lying areas. This pattern of recovery is illustrated in Figure 2 for the case of Hurricane Katrina, which hit the city of New Orleans in 2005. We note, however, that New Orleans is unusual in our sample, because it is much richer (and much better lit) than most of the flooded cities.
Figure 2. Inundation and light intensity maps for Hurricane Katrina, New Orleans

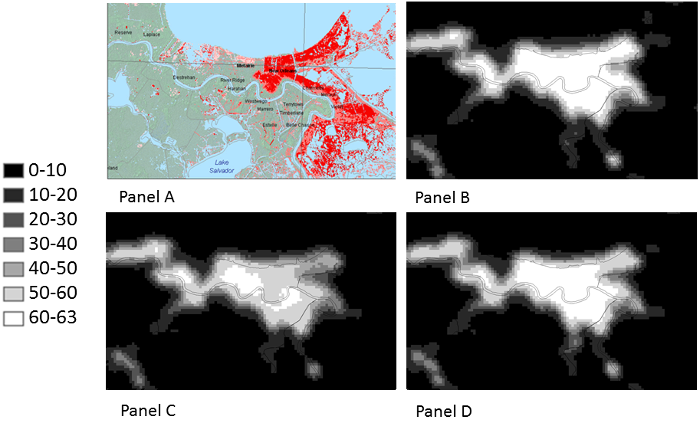
Notes: Panel A shows a detail from one of the inundation maps associated with Hurricane Katrina, concentrated on the area around the city of New Orleans. The map displays in red and pink the areas that were inundated during the flooding. Panels B, C and D show the average annual light intensity in 2004, 2005, 2006 respectively, for the city of New Orleans. There is a notable dimming of lights city-wide in 2005. In Panel D a recovery of light intensity is apparent.
Our finding that economic activity recovers after floods even in low-lying areas suggests that there is no significant adaptation, at least in the sense of a relocation of economic activity away from the most vulnerable locations. With economic activity fully restored in vulnerable locations, the scene is sadly set for the next round of flooding.
A possible motivation for restoring vulnerable locations is to take advantage of the trading opportunities – and amenity value – offered by waterside locations. But we find that economic activity is fully restored even in low-elevation locations that do not enjoy the offsetting advantages of being near a river or coast.
Our results are also robust to restricting our sample to cities with at least some areas more than 10 metres above sea level. This means that there is no movement to higher ground in the aftermath of large floods even within cities where such movement is possible.
Cities that don’t adapt
One exception to our general finding that cities do not adapt in response to large floods can be found in the subset of recently populated parts of cities (those that had no night lights in 1992). We find that in these recently populated urban areas, flooded areas show a larger and more persistent decline in night-light intensity, indicating a stronger relocation of economic activity in response to flooding. This may be because in these newer urban locations flood risk was under-appreciated and the floods led to updating, or it may be because these newer areas had fewer past investments, so moving away was less costly.
Conclusions
Our findings are important for a number of reasons.
- First, the trend towards increased urbanisation around the world, and especially in poor regions, is still ongoing. As urbanisation progresses, it is important to know whether cities adapt and their populations avoid dangerous areas. Our results suggest that flooding poses an important challenge for urban planning because adaptation away from flood-prone locations cannot be taken for granted, even in the aftermath of large and devastating floods.
- Second, floods disproportionately affect poor countries. Given the scale of human devastation and its potential to affect the formation of human capital (for example, disruptions to education or damage to people’s health), this is an important issue for growth and development. Specifically, planning and zoning laws and their enforcement are weak in developing countries. Consequently, slums and other informal urban settlements tend to develop on cheap land with poor infrastructure, which includes flood-prone land. More than 860 million people live in flood-prone urban areas worldwide. Annual increases of 6 million a year were observed between 2000 and 2010. Our finding that low-elevation areas concentrate much of the economic activity, even in poor urban areas with erratic weather patterns, highlights the tragedy of the recurring crisis imposed by flooding.
- Third, global warming, and especially rising sea levels, are expected to further exacerbate the problem of flooding in many of the world’s cities.
- Fourth, recovery assistance after flooding is an important part of international aid. Our findings suggest that in some circumstances, part of the aid and reconstruction efforts should be targeted at moving economic activity away from the most flood-prone areas, in order to mitigate the risk of recurrent humanitarian disasters.
- Finally, our results are relevant for discussions of the costly effects of path dependence (Bleakly and Lin 2012, Michaels and Rauch 2013). Our findings suggest that cities and the parts of cities that are built in flood-prone areas may be locking in exposure to flood risk for a long time.
References
Bleakley, H and J Lin (2012), "Portage and path dependence," The Quarterly Journal of Economics127(2): 587.
Bounds, A. (2015), “Floods to swamp north with £1bn-plus bill”, Financial Times, December 27.
Brakenridge, G R (2016), “Global Active Archive of Large Flood Events", Darthmouth Flood Observatory, University of Colorado, available from http://floodobservatory.colorado.edu/Archives/index.html.
Guha-Sapir, D., R. Below and Ph. Hoyois (2015), "EM-DAT: The CRED/OFDA International Disaster Database," available from www.emdat.be, Universite Catholique de Louvain, Brussels, Belgium.
Kocornik-Mina, A., G. Michaels, T. McDermott and F. Rauch (2015), "Flooded Cities", CEP working paper.
Kydland, F E, and E C Prescott (1977), "Rules rather than discretion: The inconsistency of optimal plans," The Journal of Political Economy: 473-491.
Michaels, G and F Rauch (2013), "Resetting the urban network: 117-2012", Bureau for Research and Economic Analysis of Development (BREAD).