


Incentivising civil servants to gather evidence before making decisions significantly reduced errors in the beliefs of Ethiopian government officials
We all make mistakes. An increasing number of studies have shown that everyday decisions in a variety of contexts are plagued by random errors, biased or unbiased. Kahneman et al. (2016) document how employees from the same private organisations make very different assessments of the same customers. They demonstrate how deviations from objective evaluations go on to be costly to the firms they study. Various studies document how professional forecasters make large but predictable mistakes (Ehrbeck and Waldmann 1996, Andrade and Le Bihan 2013), costing those that follow their advice.
These errors have detrimental consequences for individuals, but can have society wide effects when they occur in the public sector, where finite resources are allocated across citizens. So how large are the errors that public officials make?
Making informed decisions in the public sector
When public officials hold mistaken beliefs, they can skew the distribution of public resources and distort the effectiveness of public policy. For example, by mis-estimating the needs of citizens across constituencies, public officials skew the simple distribution of resources away from the most needy and potentially undermine the effectiveness of the policy designed to assist them.
It is often assumed that public officials ignore evidence when designing public policy (Duflo 2017). In a new paper (Rogger and Somani 2018), we provide empirical evidence on their main information sources, how well they know their local environment, and why some public officials do better than others in reducing the noise surrounding decision making.
Where do civil servants get their information?
Direct evidence on public sector decision making is limited. Banuri et al. (2014) find evidence that public officials in the United Kingdom (UK) and the World Bank are subject to psychological biases in decision making, such as sunk cost bias, the framing of losses and gains, and confirmation bias.
However, our interest is in the raw information public officials use to make their decisions and the noise it contains. We report on a survey of public officials in which we explicitly asked them where they sourced data for decision making. We surveyed 1,831 public officials across 382 organisations spanning all three tiers of Ethiopia's Government.
The most frequently cited source of information for these officials was ‘Formal field visits’, with 63% of officials stating that this was a key source of information. Discussions with frontline colleagues, and informal interactions with colleagues in their organisation were the second and third most cited sources of information, with 51.9% and 45.9% of officials stating their significance respectively.
Together, information gained through the direct experience of the individual - from field visits or interacting with colleagues or citizens - is one of the top three sources of information collection for 90% of the officials in our data.
Only 12.8% of officials state that they use management information systems (MIS) as their primary source of information. Field visits and informal interactions are therefore three times more likely to be in the top three most important sources of information than MIS, and ten times more likely than external media sources.
These responses indicate that the dominant form of information used for decision making in the Ethiopian public sector is in terms of knowledge transmitted or gained through personal experience, widely known as the ‘tacit’ knowledge of individuals. A review of World Bank practice argued the same reliance on tacit knowledge by Bank staff (World Bank, 2011).
How much noise is there in public officials' beliefs?
To assess the quality of the information, we asked the surveyed officials to report their beliefs on key characteristics of the population they worked with, such as size, as well as quantities specific to their sector. For example, we asked officials in the education sector about the number of primary school students in their constituency, the number of students per primary school, and so on.
By comparing the responses of these officials to administrative and survey data on the same variables, we are able to assess the 'noise' in official's beliefs. Once again turning to education as an example, we use administrative data from primary schools on the number of students they have enrolled to assess the accuracy of public officials’ beliefs on this indicator.
In a minority of cases, the public officials we study make relatively accurate claims about their constituents. Of officials’ assessments of the population they serve, 21.5% are within 20% of the census-defined population. However, many officials were far from accurate. Figure 1 provides the distribution of errors across officials on this statistic.
Figure 1 Errors of public officials regarding the population they serve
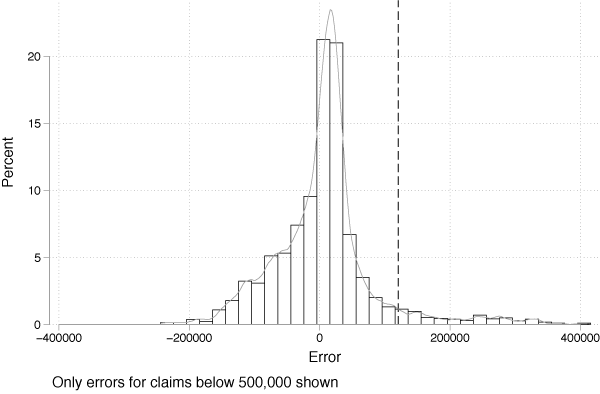
The dashed vertical line represents the median population of a district in our sample (120,398) to give a sense of the magnitude of the errors for this indicator:
- 16% of claims by officials over or underestimate the size of the claimed district by more than the population of the median district.
- 37% of officials overestimate or underestimate the population of the district by more than half the population of the median district.
- 47% of officials claim that their district’s population is 50% bigger or smaller than it is.
The scale of errors is similar across the distribution of district populations, implying that public officials are indeed adjusting their estimates towards the underlying state of nature, but doing so with a lot of noise.
Consistent with the findings in Kahneman et al. (2016), the distribution of errors among other variables is similarly large. The estimates of 16% (23%) of public officials regarding the characteristics of their constituents are at least a standard deviation (half a standard deviation) away from the objective benchmark data we collect. The mean absolute error in education bureaucrats’ estimates of primary enrollment numbers is 76% of the true enrollment figures. Across all of the education variables, the mean absolute error is 51% of the benchmark data. The mean error in estimates of the proportion of pregnant women who attended ANC4+ during the current pregnancy (the ‘antenatal care rate’) was 38% of the benchmark data. Agriculture officials overestimate the number of hectares in their district that are recorded as used for agricultural purposes by almost a factor of 2.
Why does this matter?
If this is the scale of noise in the information that public officials use to make decisions, what does this mean for public policy? In the paper, we discuss a thought experiment in which government's only job is to distribute an equal share of public resources to each citizen.
Figure 2 calculates the de facto weights the officials we study unwittingly embed in their distribution of resources across individual citizens by dividing the perceived population by the actual population.
Figure 2 Weights on districts implied by public officials' beliefs
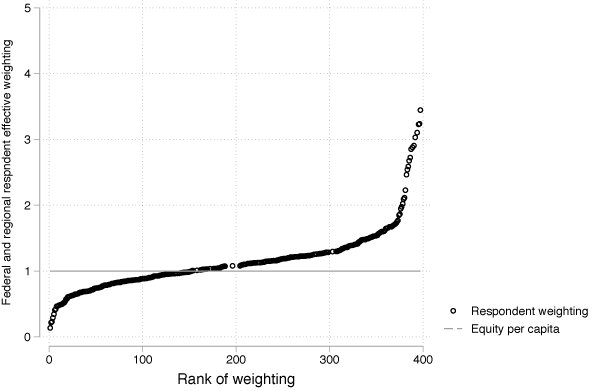
Each observation can be interpreted as the weight that a public official places on the median district in their region of interest relative to the weight that should be assigned when using the actual population data. A value of 1, therefore, signifies that the civil servants assigned a weight that accurately reflects the population data.
To the far right of the figure we see that one official in our data would mistakenly weight the population of one district 3.5 times as high as the actual population would justify. And 14% of officials would weight the median district in their region at least 1.5 times more than its population justified.
Consequently, relative to an equitable distribution of government resources across constituents, central officials would over disburse by 30% to districts at the 75th percentile of the distribution of errors, and under disburse by 12% to those at the 25th percentile of errors.
In real life policymaking, noise in population estimates would be compounded by noise in other variables, such as school enrolment. For example, a public official may underestimate the number of children within an area they are responsible for, as well as how many of them are at school. This would have far reaching consequences for education policy.
What can we do about it?
Much of the paper deals with the underlying reasons for these errors. We find descriptive and experimental evidence for organisational incentives being the dominant determinant of the errors we report. When public officials are given authority over decision making, they invest in more accurate beliefs about the constituents they serve. When they work in an organisation that rewards information gathering, they do more of it.
To assess the potential impact of external 'briefings' in reducing errors, we randomly sent a subset of officials a data briefing on the variables we later tested. It had large and significant impacts on the level of errors made by officials, of the order of a third of a standard deviation.
Interestingly however, the impact of our experiment is mitigated by organisational incentives. As Figure 3 shows, the treatment has the largest impacts where management practices around information acquisition are weakest.
Figure 3 The effect of the treatment on absolute errors of civil servants by monitoring management practices
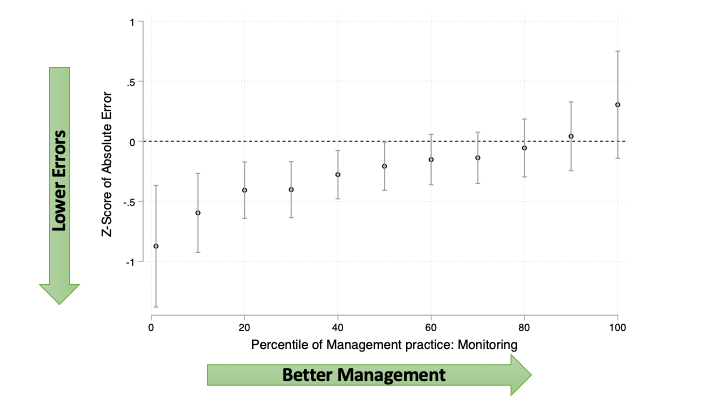
This implies that there may be an important interaction between updating the beliefs of public officials and the organisational incentives in which they work. Informing public policy will require both better research as well as better public sector incentives.
References
Banuri, S, S Dercon and V Gauri (2014), “Biased Policy Professionals”, World Bank Policy Research Working Paper 8113.
Hanna, R, S Mullainathan and J Schwartzstein (2014), “Learning Through Noticing: Theory and Evidence from a Field Experiment”, The Quarterly Journal of Economics 129(3).
Kahneman, D, A M Rosenfield, L Gandhi and T Blaser (2016), “Noise: How to Overcome the High, Hidden Cost of Inconsistent Decision Making”, Harvard Business Review, October.
Rogger, D O and R Somani (2018), “Hierarchy and Information (English)”, World Bank Policy Research Working Paper WPS 8644.
World Bank (2011), “World Bank Approach to Public Sector Management 2011-2020: Better results from public sector institutions”, Extended Working Draft for Consultation.