


Evidence from the housing market suggests inequality is being substantially underestimated in Egypt, by about 33%
Egypt ranks as one of the world’s most equal countries judging by official estimates of income and consumption inequality. Estimates of inequality, like estimates of poverty, are derived from national household surveys that collect detailed income and/or consumption data for a sample of households, assumed to be representative of the country’s population. We consulted the World Bank’s PovcalNet, a repository of household income and consumption surveys from around the world, to obtain estimates of the Gini coefficient for 135 countries around 2008-09 (the most recent period for which we have survey data for Egypt). The result is presented in Figure 1 and the estimate for Egypt is highlighted in blue.
The Gini coefficient
The Gini coefficient is arguably the most commonly used measure of inequality; it ranges between 0 and 1 with higher values indicating more inequality. The most unequal countries are on the left – South Africa’s Gini, for example, is 0.63 (not highlighted) – and we move to the right as inequality declines. As can be seen, Egypt’s Gini is just over 0.3, which is low by international standards. It is even low by the standards of the rest of the countries in the Middle East and North Africa (highlighted in red). This will come as a surprise to many Egyptians.
Figure 1 Gini coefficient for 135 countries from around the world
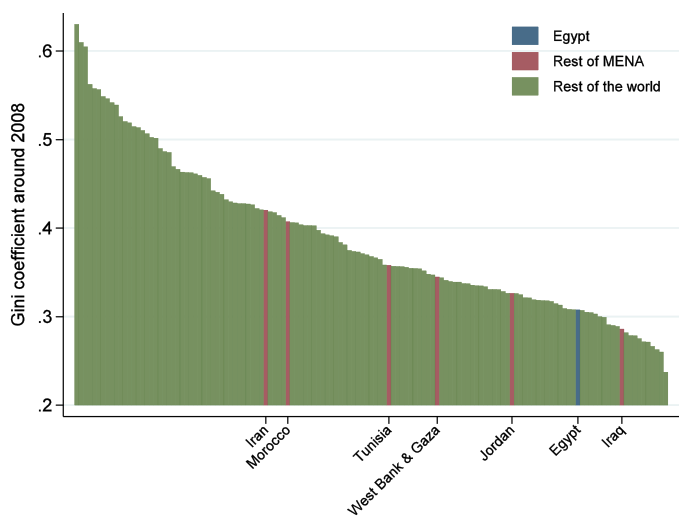
Note: Countries sorted by Gini index (from highest to lowest inequality). Surveys are within two years of 2008.
Source: Authors’ calculations based on PovcalNet and All the Ginis (Milanovic 2014).
Inequality in Egypt
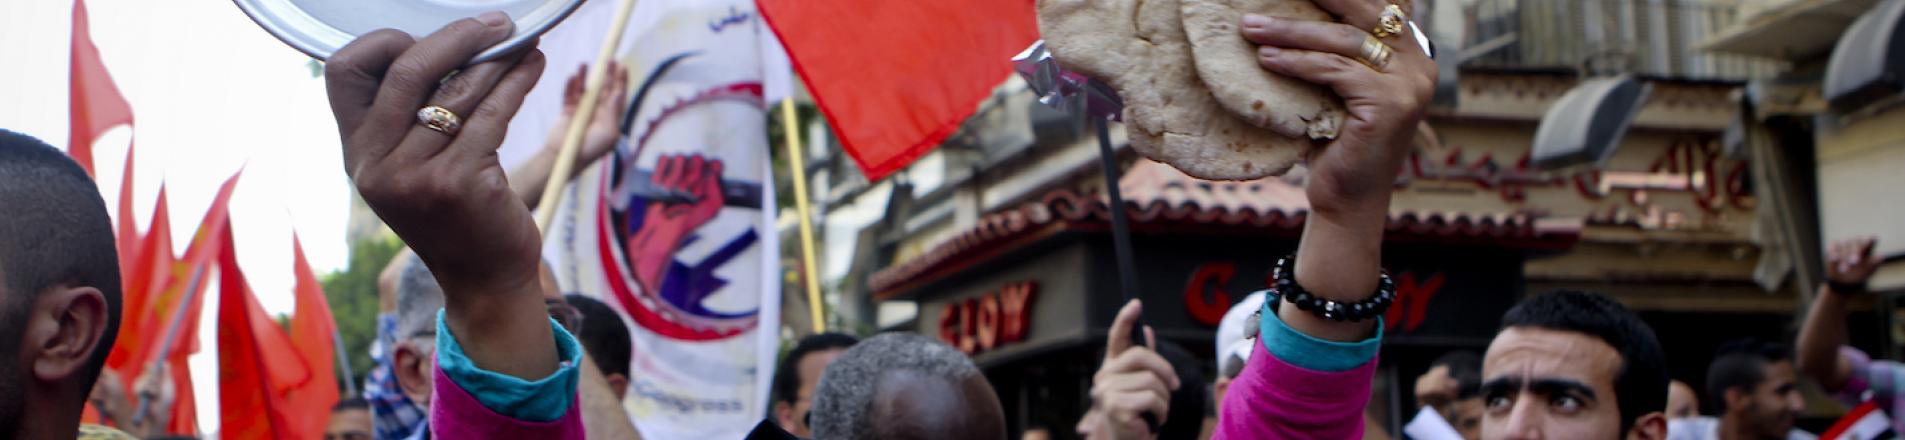
In Egypt, there is a sense that economic success is reserved for the privileged, and that opportunities for the majority are largely missing. For example, Assaad (2013) estimates that a child from a disadvantaged family has a one-in-ten chance of enrolling into university, while a child from a privileged family is virtually guaranteed to make it to university. Efforts to redistribute income from the rich to the poor are also limited. Taxes have become more regressive, particularly since 2005, as has been documented in a recent op-ed by Diab (2016). There have been some efforts to restore a degree of progressivity, but these have encountered resistance. During this period, signs of inequality have become increasingly more visible. Diab (2016) writes, “In Egypt, where luxury hotels and upscale neighborhoods abut sprawling informal settlements, inequality is out in the open, bringing with it the constant potential for social unrest.”
Egypt in the Arab Spring
In early 2011, social unrest broke out. The increased level of inequality may not have been the decisive issue in the revolution (Lanchovichina 2018), although some argued it might have contributed (Ncube and Anyanwu 2012, Hlasny and Verme 2016). Protesters were arguably motivated by a mix of economic and political grievances (Kinninmont 2012, Arampatzi et al. 2015). It is conceivable, however, that many of these grievances are related to inequality one way or another. Think of the deterioration of public education and healthcare, chronic corruption, crony capitalism, police brutality, poor working conditions, low pay, and lack of accountability. Those who can afford it rely increasingly more on private service provision in education and healthcare, which contributes to a widening of the cleavage between the privileged and the rest of society, something van der Weide and Milanovic (forthcoming) refer to as “social separatism” (see also their VoxEU column). These persistent government failures arguably served as the dominant grievance and did not go unnoticed by the leading political parties, who made economic inequality a defining issue in their election manifestos after the revolution had successfully brought down Mubarak, making place for Egypt’s first democratic election (Kinninmont 2012).
Are official estimates misleading?
Could it be then that inequality is higher in Egypt than official estimates lead us to believe? Alvaredo and Piketty (2014) conjecture that inequality is indeed being underestimated. This should come as no surprise. Household surveys often fail to capture top incomes, either due to non-response of the rich or under-reporting of their incomes or both, which then leads to an underestimation of income inequality. Recent literature on top-income shares effectively sums up the existing evidence (Atkinson et al. 2011, Alvaredo and Piketty, 2014). A popular solution is to estimate the top tail of the income distribution from income tax record data, estimate the rest (often 99%) of the income distribution using the household survey, and then combine the two to obtain an estimate of the complete income distribution (Atkinson et al. 2011, Alvaredo 2011, Alvaredo and Londoño Vélez 2013, Anand and Segal 2015).
Income tax records arguably denote the ideal source of data as far as top incomes are concerned. Unfortunately, tax record data are hard to come by, and Egypt is no exception to that rule. Hlasny and Verme (2016) made an attempt to re-estimate inequality by explicitly modeling the non-response among top-income households which introduces a re-weighting of the available observations. This yields only a modest correction, possibly because their approach does not consult a second, external source of data. If the main problem is that top-income households are simply missing from the household survey, then no adjustment that relies solely on the survey will resolve the downward bias in estimates of inequality.
A potential solution: Using house prices to estimate incomes of the richest, and its implications
In the absence of tax record data, our research explores the feasibility of using data on house prices to estimate the top tail of the income distribution (Van Der Weide et al. 2016). The house price database is compiled from real estate listings that are available in the public domain. Our study uses this data to estimate the top tail of the house price distribution. It also estimates the relationship between the house price and household income using the household survey. The two are then combined to obtain an estimate of the top tail of the income distribution, which in turn is combined with an estimate of the rest of the income distribution. We find evidence that inequality is indeed being underestimated in Egypt by a considerable margin. The Gini coefficient of household consumption expenditure for urban Egypt is found to increase from 0.36 to 0.47 after correcting for the missing top tail. When using household per capita income, which tends to show higher levels of inequality, the Gini increases from 0.39 to 0.52. To put this correction in context, note that it is larger than the difference between the Gini of the US (0.41) and that of Sweden (0.28) in 2013, and the correction to the consumption-based Gini is equivalent to the difference between the Gini of the US (0.41) and that of Germany (0.31) (PovcalNet).
Looking more closely at the top part of the Egypt’s income distribution, we find that the income share of the richest 1% in urban Egypt increases from 8.9% to 15.1%. Are these numbers for the top income shares reasonable? A recent paper that uses fiscal data from Lebanon, national accounts and rich lists, finds that the top 1% income share for Egypt is even larger, at 19% in 2008 (Alvaredo et al. 2017). Furthermore, in a rough calculation, the paper finds that there are approximately 300 households in Cairo whose household income exceeds $1 million per year, which seems a rather conservative estimate.
Relying on predictors of top incomes rather than actual incomes derived from tax records is not without caveats. For example, one needs to make assumptions about the relationship between house prices and household income, and about the upper tail of the house price distribution. In addition, it is assumed that one house constitutes one household and that all houses are domestically owned. Therefore, in cases where tax record data are available, these should undoubtedly be considered first. Having said that, we believe that this approach will provide more reliable estimates of inequality than estimates obtained using survey data alone. (This is confirmed in a robustness analysis provided in the Annex to Van Der Weide et al. forthcoming). The perfect should not be the enemy of the good.
Implications elsewhere
Using a similar methodology, it is conceivable that inequality estimates for other countries may similarly be downward biased. When household surveys are combined with income tax data:
- the Gini coefficient for the US in 2006 increases from 0.59 to 0.62 (Alvaredo 2011);
- the Gini for Colombia in 2010 increases from 0.55 to 0.59 (Alvaredo and Londoño Vélez 2013); and
- the Gini for South Korea in 2010 increases from 0.31 to 0.37 ((Alvaredo and Londoño Vélez 2013, Kim and Kim 2013).
Ideally, one would apply these corrections to all countries. Where Egypt would rank in this hypothetical version of Figure 1, nobody knows.
References
Alvaredo, F (2011), “A note on the relationship between top income shares and the Gini coefficient”, Economics Letters 110: 274-277
Alvaredo, F and J Londoño Vélez (2013), “High incomes and personal taxation in a developing economy: Colombia 1993-2013”, Commitment to Equity-CEQ Working Paper 12,
Alvaredo, F and T Piketty (2014), “Measuring top incomes and inequality in the Middle East: Data limitations and illustration with the case of Egypt”, ERF Working Paper 832.
Alvaredo, F, L Assouad, and T Piketty (2017), “Measuring Inequality in the Middle East 1990-2016: The World’s Most Unequal Region?” WID.world Working Paper 2017/15
Arampatzi, E, M Burger, E Ianchovichina, T Rohricht, and R Veenhoven (2015), “Unhappy Development: Dissatisfaction with Life in the Wake of the Arab Spring”, World Bank Policy Research Working Paper 7488
Assaad, R (2013), “Equality for all? Egypt’s free public higher education policy breeds inequality of opportunity”, in A Elbadawy (ed), Is there equality of opportunity under free higher education in Egypt? (Arabic), New York: Population Council
Atkinson, A, T Piketty, and E Saez (2011), “Top incomes in the long run of history”, Journal of Economic Literature 49: 3-71
Diab, O (2016), “Egypt’s widening wealth gap”, Mada Masr, 23 May.
Hlasny, V and P Verme (2016), “Top incomes and the measurement of inequality in Egypt”, The World Bank Economic Review, Advance Access, 10 July.
Ianchovichina, E (2018), Eruptions of Popular Anger: The Economics of the Arab Spring and Its Aftermath, MENA Development Report, Washington, DC: World Bank Group.
Kim, N and J Kim (2013), “Reexamining income distribution indices of Korea” (in Korean), Journal of Korean Economic Analysis 19: 1-57
Kinninmont, J (2012), “`Bread, dignity and social justice’: The political economy of Egypt’s transition”, Chatham House Briefing Paper, April.
Milanovic, B (2014), “Description of All the Ginis Dataset”.
Ncube, M and J Anyanwu (2012), “Inequality and Arab Spring revolutions in North Africa and the Middle East”, Africa Economic Brief, African Development Bank.
van der Weide, R and B Milanovic (forthcoming), “Inequality is bad for growth of the poor (but not for that of the rich)”, World Bank Economic Review.
van der Weide, R, C Lakner and E Ianchovichina (2016), “Is inequality underestimated in Egypt? Evidence from house prices”, World Bank Policy Research Working Paper 7727.
van der Weide, R, C Lakner and E Ianchovichina (forthcoming), “Is inequality underestimated in Egypt? Evidence from house prices”, Review of Income and Wealth.