


Over the last fifteen years, the rate at which low-income countries are graduating to middle-income status has slowed markedly amid mounting headwinds. This trend presages more challenges ahead, but these countries also have considerable untapped potential.
In the first decade of this century, low-income countries (LICs) made remarkable progress
This year marks the end of the first quarter of the 21st century, an opportune time to review the progress made by low-income countries since 2000. Twenty-five years ago, the international community agreed on a set of development goals meant to galvanise global action to end extreme poverty and support sustainable growth and development. At the time, there were 63 countries classified as low-income countries (LICs). They were home to just over 40% of the global population and about 60% of the 2.2 billion people then living in extreme poverty worldwide. A decade later, by 2010, robust growth had helped to reduce extreme poverty considerably and whittle down the number of LICs to 35 (Figure 1, Dollar et al. 2016).
Figure 1: Number of LICs over time
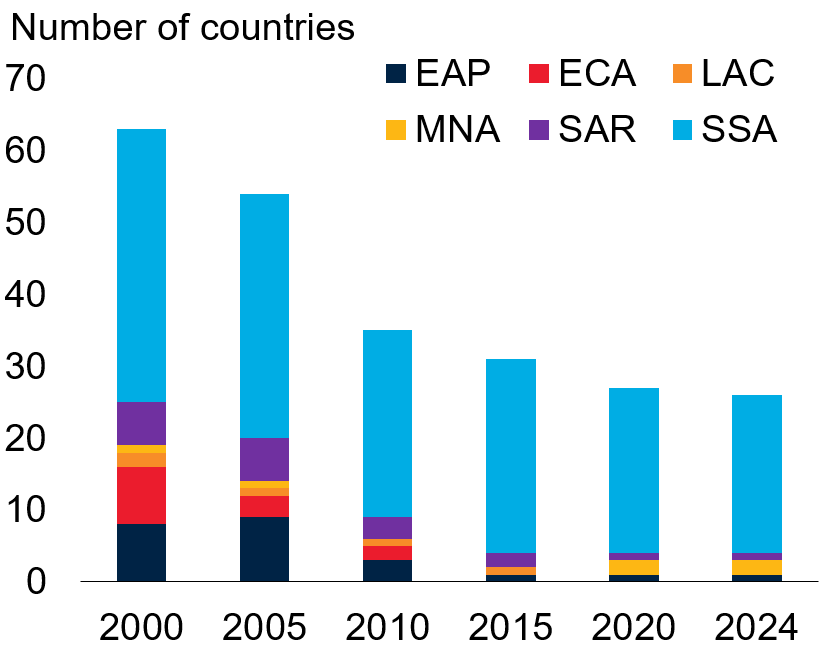
Source: World Bank. Notes: EAP = East Asia and the Pacific; ECA = Europe and Central Asia; LAC = Latin America and the Caribbean; MNA = Middle East and North Africa; SAR = South Asia; SSA = Sub-Saharan Africa. LICs = low-income countries (includes the Democratic People’s Republic of Korea).
In the last fifteen years, however, severe headwinds have pinned back progress toward middle-income status in LICs
Since 2010, LICs’ progress up the income ladder has slowed markedly. Twenty-four countries that were LICs at the turn of the century remain so, with per capita incomes below $1,145 in 2023. South Sudan and the Syrian Arab Republic have joined their ranks, raising the total to 26 LICs today. These countries—mostly in sub-Saharan Africa—comprise only 9% of the global population but still close to half of people living in extreme poverty.
Heightened conflict, worsening climate shocks, and frequent economic crises have marked the last fifteen in years in LICs. Annual per capita growth in these countries collectively has averaged near zero, while extreme poverty has largely ceased falling (World Bank 2025a). These headwinds have given rise to much weaker graduation trajectories than would have been foreseen in the 2000s. Based on 2010-19 growth rates—arguably optimistic, given recent growth outcomes—only seven LICs look on course to reach middle-income status by 2050 (Figure 2). This would represent about one-quarter of eligible countries, down from the nearly two-thirds that advanced in 2000-24. More generally, today’s LICs lag where economies that turned middle-income in the last twenty-five years, or “LICs-turned-middle income” (LTMs), stood in 2000 across a wide array of development metrics.
Figure 2: Falling growth and lower graduation trajectories in LICs

Source: World Bank. Notes: Graduation trajectories assume that the threshold for LIC status increases at the same pace as it has on average since 2000.
Although recent years paint a troubling picture, the future need not be like the past
The historical record shows that, starting from low-income levels, countries with the right conditions in place can see remarkably rapid and sustained improvements in living standards. Growth accelerations—defined as at least eight years of substantially increased per capita growth—have taken root from low-income levels 26 times since 1990 (Figure 3; Gootjes et al. 2024). These spells lasted nearly 16 years, on average, with per capita GDP growth averaging close to 7% annually. Such accelerations have tended to follow policy shifts prioritising investment (in Ethiopia and Nepal, for example), and reforms to improve the business environment (Kenya, Viet Nam). Peace and a baseline level of political stability have been essential, but even in countries torn by conflict, growth accelerations have sometimes taken root relatively soon after peace was achieved (Nepal, Rwanda). In some instances (Ethiopia, Rwanda), internationally coordinated debt relief also played an important role.
Figure 3: Previous growth accelerations from low-income status

Source: World Bank. Notes: Accelerations defined with respect to a country-specific threshold. See Gootjes et al. 2024 for details. LTMs sample includes 19 accelerations; LIC sample includes seven accelerations. The accelerations count beyond 2016 will not yet capture any new accelerations as eight years of data are required. LICs = low-income countries; LTMs = LICs turned into middle-income countries.
For today’s LICs, advancing to middle-income status requires overcoming daunting challenges
High-fatality conflict has been on the rise in today’s LICs. In developing economies, the onset of conflict tends to lower GDP per capita by 10 to 20% after five years, depending on its nature and intensity (World Bank 2025a, 2025b). The location and economic structure of today’s LICs, coupled with limited resources for adaptation, also renders them especially vulnerable to climate change (Figure 4a). With about half of LICs in or near debt distress, governments lack fiscal space for investments that could build resilience or support long-term growth. Moreover, many former LICs graduated amid advancing global integration, whereas the external environment today is marked by increasing trade fragmentation, geopolitical tensions, and slowing global potential growth (Kose and Ohnsorge 2024).
Today’s LICs have untapped potential that could catalyse stronger growth
LIC working-age populations will surge in the coming decades (Figure 4b). Investments in the health and education of these workforces could propel per capita incomes higher. With dependency ratios declining, domestic savings could increase, helping to finance rapid investment growth. Commodity wealth could generate resources to smooth this process: LICs are home to at least half of known cobalt and graphite reserves—both critical renewable-energy inputs—and substantial endowments of other industrial commodities (Figure 4c). In some cases, improved political stability and infrastructure could unlock the expansion of tourism. Most LICs also have favourable geography for solar power, which could help close energy gaps. And, with LICs concentrated in Sub-Saharan Africa, regional trade integration—including further implementation of the African Continental Free Trade Area (AfCFTA)—could reduce trade costs and deepen export potential (Geda and Yimer 2022).
Figure 4: Challenges and growth opportunities in LICs
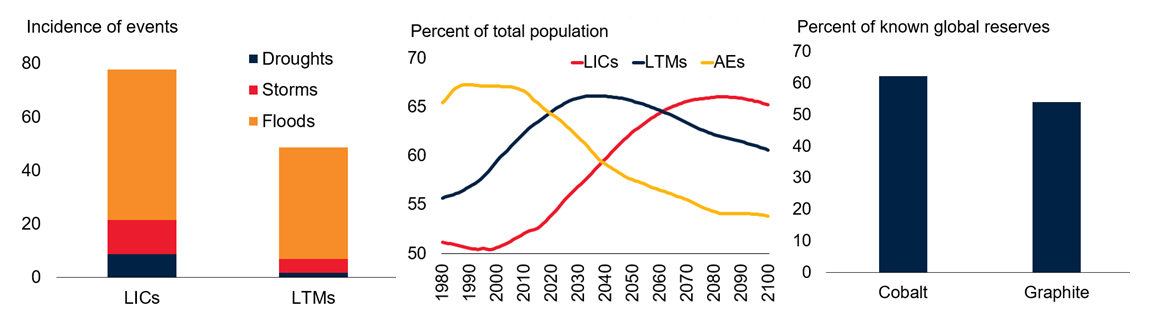
A. Extreme climate-related events B. Working age populations C. Mineral reserves in LICs
Sources: EM-DAT (database); S&P Global; UN World Population Prospects (database); World Bank. Notes: AEs = advanced economies; EMDEs = emerging market and developing economies; LICs = low-income countries; LTMs = LICs turned into middle-income countries. Panel A: Incidence of events defined as total number of events per million square kilometres of country area between January 2000 and May 2024. Panel B: Population-weighted averages. Working-age population defined as people aged 15–64. Based on 25 LICs and 40 LTMs. Panel C. Share of known global mineral reserves. Data are from 2022.
Accelerating progress will require the coordinated efforts of domestic policymakers and the global community
LICs can prioritise reforms that have fostered sustainable increases in investment growth in developing economies. These include deepening trade integration, enhancing governance and monetary policy frameworks, and embedding prudent fiscal frameworks (de Haan et al. 2025). Binding constraints must also be addressed. For LICs in conflict, greater peace and stability are prerequisites for economic progress. For LICs facing debt distress, building fiscal space is a critical growth enabler. Greater international support will also be essential. By some estimates, LICs require additional investment of 8% of GDP annually through 2030 to meet development objectives (World Bank 2022). Coming anywhere close will require significantly increased concessional financing—sometimes in the form of debt relief. More broadly, it will become increasingly challenging for countries to climb the income ladder if movements toward protectionism undercut trade-led development. By resisting such temptations and embracing cooperation, other nations can provide LICs with more room to grow.
Authors’ note: The findings, interpretations, and conclusions expressed in this column are entirely those of the authors. They do not necessarily represent the views of the World Bank, its Executive Directors, or the countries they represent.
References
de Haan, J, K Stamm, and S Yu (2025), “Investment accelerations,” Structural Change and Economic Dynamics, 73 (June): 196–210.
Dollar, D, T Kleineberg, and A Kraay (2016), “Growth still is good for the poor,” European Economic Review, 81 (January): 68–85.
Geda, A and A Yimer (2022), “The trade effects of the African Continental Free Trade Area: An empirical analysis,” The World Economy, 46(2): 328–345.
Gootjes, B, J de Haan, K Stamm, and S Yu (2024), “Identifying growth accelerations,” World Bank.
Kose, M A and F Ohnsorge (eds.) (2024), "Falling long-term growth prospects: Trends, expectations, and policies," World Bank.
World Bank (2022), “Climate and development: An agenda for action—Emerging insights from World Bank Group 2021-22 country climate and development reports,” World Bank.
World Bank (2025a), “Global Economic Prospects,” January, World Bank.
World Bank (2025b), “Global Economic Prospects,” June, World Bank.