


Industrial policy is often discussed through high-level narratives and flagship initiatives, yet its implementation—particularly at the subnational level—remains opaque. By using large language models (LLMs) to systematically analyse over three million government documents from 2000 to 2022, we document four sets of facts on China’s industrial policies, shedding light on the underlying rationale for choosing target sectors, the dynamics of policy tools, diffusion and similarity of policies, and effects on firm entry and productivity.
Industrial policy is experiencing a powerful resurgence around the world (Juhász et al. 2025), alongside a revitalised academic interest. Echoing Rodrik (2009), the question is not whether industrial policy should exist, but how it should be practiced: What sectors are targeted? Which tool(s) are used for which industry and in what phase of the industry's development? How do governments experiment with and learn about the choice of sectors and policy tools? How do governments strike a delicate balance to boost entry and improve productivity while preventing excessive entries and potential overcapacity? What is the role of political incentives in shaping policy choices and outcomes?
Yet empirical work remains constrained by a lack of systematic, large-scale, and granular data. In Fang, Li, and Lu (2025), we address this gap by building a comprehensive, structured database of industrial policy texts across multilevel government in China, a country that makes extensive use of industrial policies in its sectoral development and technology upgrading. Furthermore, China’s hierarchical government, which blends central guidelines with local discretions, helps shed light on the coordination and diffusion of policymaking and creates rich policy variations ideal for empirical analysis.
Industrial policy is prevalent but unevenly distributed across regions in China
We begin by constructing a dataset of three million unstructured government policy documents issued between 2000 and 2022. We develop a hallucination-robust LLM pipeline to classify each document as industrial policy or not and extract key information from those identified as such.
This process identifies 768,387 industrial policy documents—roughly 25% of all government policy texts. As shown in Table 1, most policies are issued by subnational authorities: 13% from the central government, 45% from provincial, and 39% from city-level governments. Only a small fraction (3%) come from counties and townships. Figure 1 highlights the decentralised yet active role of local governments in China’s industrial policymaking.
Table 1: Industrial policies vs. other policies, by government level
| Industrial Policy | Other | Overall | |||
|---|---|---|---|---|---|
| # | % | # | % | ||
| Central | 101,250 | 30.86 | 226,892 | 69.14 | 328,142 |
| Province | 344,321 | 26.82 | 939,492 | 73.18 | 1,283,813 |
| City | 295,698 | 23.49 | 962,940 | 76.51 | 1,258,638 |
| District/County | 27,040 | 21.60 | 98,142 | 78.40 | 125,182 |
| Township | 78 | 12.83 | 530 | 87.17 | 608 |
| Total | 768,387 | 25.64 | 2,227,996 | 74.36 | 2,996,383 |
Over time, the volume of industrial policy documents has steadily increased, with a rising share exhibiting a supportive tone. Geographically, policy intensity is higher in more developed regions, suggesting a link between local capacity and policy activity.
Fact 1: Industrial policy is multidimensional
Using LLMs, we extract structured fields from each industrial policy, including the issuing government, list of targeted industries, policy objectives, policy tone (supportive or regulatory/suppressive), policy tools, and a host of others.
This rich metadata moves us beyond binary definitions of industrial policy. In terms of objectives, promotion of strategic sectors appears in 56% of documents. Manufacturing and production-related services are frequently targeted (29% and 40%, respectively). While the share of policies targeting manufacturing has slightly declined, within-manufacturing policies increasingly emphasise high-tech and emerging industries, consistent with China's upgrading agenda.
In terms of policy tools, we guide the LLM to classify them into 20 tools. Although fiscal subsidies are the most common policy tool, appearing in 41% of the policies, over half do not employ fiscal subsidies, suggesting the significant bias of the existing measures of industrial policy which rely on the level of government subsidies. Table 2 shows tool variation across government levels. Local governments favour tools that directly support firms, using fiscal subsidies, labour policies, and infrastructure investment far more frequently than the central government. In contrast, the central government plays a more strategic and regulatory role, emphasising tools like market access and regulation and trade protection, and focusing policy attention on strategic industries.
Table 2: Industrial policy implementation tools, by government level
| All | Central | Province | City | |
|---|---|---|---|---|
| Fiscal and Financial Tools | ||||
| Credit and Finance | 0.14 | 0.11 | 0.12 | 0.18 |
| Tax Incentives | 0.20 | 0.20 | 0.16 | 0.23 |
| Equity Support | 0.05 | 0.04 | 0.04 | 0.06 |
| Fiscal Subsidies | 0.41 | 0.25 | 0.39 | 0.48 |
| Entry and Regulation Tools | ||||
| Industrial Fund | 0.07 | 0.04 | 0.06 | 0.09 |
| Promote Entrepreneurship | 0.06 | 0.04 | 0.05 | 0.08 |
| Investment Policy | 0.13 | 0.11 | 0.12 | 0.16 |
| Improving Business Environment | 0.18 | 0.13 | 0.15 | 0.22 |
| Market Access and Regulation | 0.35 | 0.42 | 0.34 | 0.34 |
| Trade Protection | 0.09 | 0.19 | 0.08 | 0.07 |
| Input Policy Tools | ||||
| Labour Policy | 0.22 | 0.16 | 0.21 | 0.27 |
| Preferential Land Supply | 0.13 | 0.06 | 0.1 | 0.17 |
| Infrastructure Investment | 0.18 | 0.11 | 0.16 | 0.23 |
| Technology R&D and Adoption | 0.24 | 0.21 | 0.23 | 0.27 |
| Environmental Policy | 0.13 | 0.09 | 0.12 | 0.16 |
| Demand Side Tools | ||||
| Consumer Subsidy | 0.05 | 0.04 | 0.05 | 0.07 |
| Government Procurement | 0.07 | 0.05 | 0.07 | 0.08 |
| Industrial Promotion | 0.10 | 0.07 | 0.1 | 0.12 |
| Supply Chain Tools | ||||
| Promote Industrial Cluster | 0.14 | 0.08 | 0.12 | 0.18 |
| Localisation Policy | 0.05 | 0.03 | 0.04 | 0.06 |
| Observations | 741,269 | 101,250 | 344,321 | 295,698 |
Fact 2: Industrial policy is shaped by local advantage, top-down hierarchy, and local politicians’ career incentives
We examine the drivers of sector selection and find a combination of economic logic, administrative capacity, and political incentives.
First, we construct measures of a city’s relative advantage from firm registration data based on the cumulative registered capital of firms registered in the city in each industry; two of the measures proxy the city’s revealed comparative advantage (RCA) within the province and within the nation, respectively, and a third measure proxies the city’s absolute advantage (AA).
Cities are more likely to target sectors with higher RCAs, particularly when their fiscal capacity proxied by per capita GDP is high. We find that both RCAs and AAs positively predict sector targeting, but richer cities are more effective in targeting sectors with RCAs instead of AAs.
Second, cities tend to follow upper-level governments in sector choices. This top-down policy pass-through is stronger in less developed regions, in jurisdictions with weak ties to higher-level authorities, and when local leaders face stronger political competition. We find that top-down pass-through rates exhibit interesting dynamics. Figure 1 suggests a turning point around 2013 for an elevated top-down pass-through, which is consistent with a political recentralisation in China’s policymaking.
Figure 1: The dynamics of policy pass-through
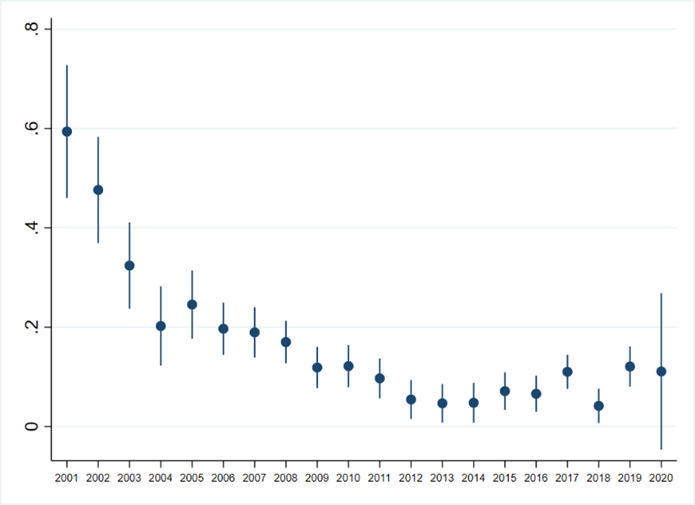
Notes: Figure 1 displays the regression coefficients in the sector choice of the city governments on the sector choice of their provincial governments over time.
Finally, policy choices exhibit a certain level of persistence but are sensitive to political turnover. When a local official is replaced, the new leader often shifts the targeted sectors priorities to align with the policies in their previous post, suggesting that a politician’s rotation serves as an important channel for policy diffusion in China.
Fact 3: Industrial policy instruments evolve with the maturity of the targeted industry
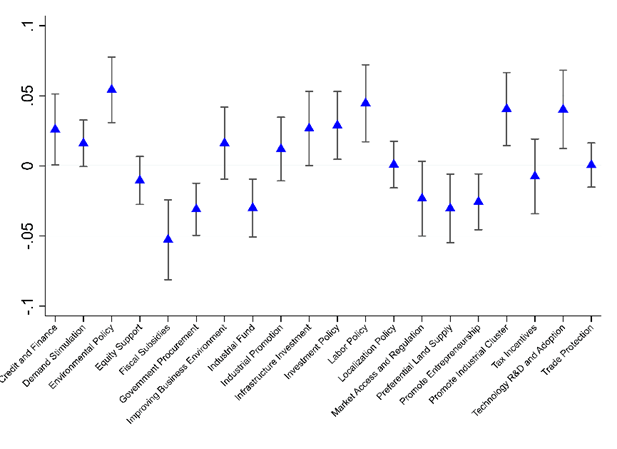
Importantly, policy tools often appear in bundles and evolve with industry maturity. To examine this, we regress the indicator for the use of each tool on the number of years that an industry has been targeted in each city. A positive coefficient indicates an increasing likelihood of tool utilisation as the industry matures (more years from the initial target year in the city). As shown in Figure 2, in the early phases of an industry, local governments are more likely to use policy tools that lower entry barriers, such as fiscal subsidies, preferential land supply, market access reforms, and entrepreneurship promotion. As the industries mature, however, the choice of policy tools tends to shift more toward R&D, labour and skills development, supply chain coordination, and consumer-side demand stimulation (e.g. subsidies, trade fairs, government procurement).
Figure 2: Within-industry change in policy tool and implementation method
Fact 4: As policy diffuses across cities, local protectionism arises and policy effectiveness declines
To evaluate policy effectiveness, we match industrial policy exposure with firm-level outcomes. On average, firms in targeted sectors enjoy monetary benefits, including more subsidies, higher tax deductions, and better access to finance. These translate into higher firm entry rates, and a positive but short-lived association with firm productivity.
Figure 3: Policy sector similarity and local protectionism
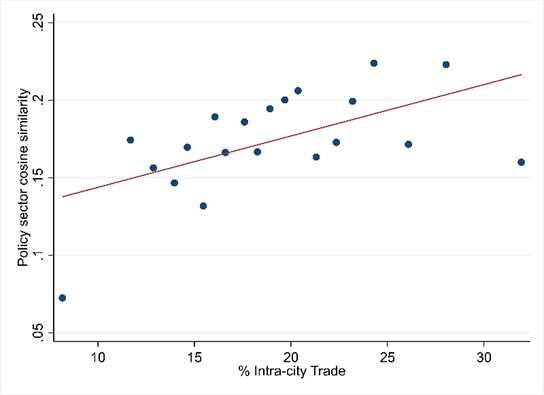
Notes: Policy overlap is measured by the cosine similarity of the policy vectors between each city pair.
Yet imitation has costs. Our analysis shows that cities in China often adopt similar industrial policies—especially cities within the same province—leading to duplication, inefficient competition, and overcapacity. This policy overlap is linked to growing local protectionism: firms trade more with other firms within the city, as shown in Figure 3.
We also provide empirical evidence that imitating the sectors supported by pioneering cities is often ineffective or even counterproductive. Further examining the mechanism behind the ineffectiveness of policy diffusion, we find that as policies diffuse across regions, policy followers are less savvy in the choices of the target industry, policy tools, and implementation methods, and more likely to follow the upper-level governments’ practices.
This suggests that industrial policy is far more complex than just a matter of copying successful models—it requires careful adaptation to local conditions including the local administrative and fiscal capacity. In addition, it highlights the challenges in coordinating policies that, on the one hand, incentivise local governments to boost entries in a target sector, and on the other hand, avoid protectionism and overcapacity from overly similar policies and excessive entries.
Implications for industrial policy in China
Our research provides the first large-scale, structured, and granular portrait of the industrial policy practice across all levels of Chinese government. Using LLMs to decode policy documents, we uncover how sector choices, toolkits, and policy dynamics are shaped by local economic fundamentals, administrative capacity, and political incentives.
These findings underscore that industrial policy is neither monolithic nor static. Its effectiveness depends critically on implementation detail, regional context, and the ability of local governments to adapt rather than simply copy. For researchers and policymakers alike, understanding how industrial policy works on the ground is crucial to assessing its true potential.
Editor's note: A version of this article also appeared on VoxChina.
References
Rodrik, D (2009), “Industrial policy: Don’t ask why, ask how,” Middle East Development Journal, 1(1): 1–29.
Fang, H, M Li, and G Lu (2025), “Decoding China's industrial policies,” Unpublished manuscript.
Juhász, R, N Lane, E Oehlsen, and V C Pérez (2025), “Measuring industrial policy: A text-based approach,” Unpublished manuscript.