

Should we intentionally expose certain areas to higher risks to protect broader regions from disasters? Evidence from China suggests that although areas specifically designated to bear higher flood risk experience economic losses, the overall economic benefit-to-cost ratio can still be greater than one.
Long-term global climate change has increased flood risks. For centuries, we have taken precautionary actions to mitigate floods, such as constructing levees and dams (Duflo and Pande 2007) and protecting wetlands (Taylor and Druckenmiller 2022). However, as the threat of extreme floods intensifies, policymakers may also face extreme decisions. A crucial question in flood management is whether to deliberately expose certain areas to higher risks, such as through flood water diversion, to protect broader regions from severe flood damage. Policymakers often face a winner-loser dilemma when making such decisions.
In 2000, the Chinese government officially implemented the Flood Detention Basin policy, which clearly designated 98 low-lying wetlands to bear higher flood risks, directly affecting more than 15 million residents across 96 Flood Detention Basin counties. Under this policy, pre-designated rural counties will be intentionally flooded in severe flood events to protect broader areas, particularly major cities, from inundation. Since its implementation, floodwaters have been diverted to Flood Detention Basin counties more than 100 times to manage excess water. It is important to acknowledge that the decision is made by the central government and residents have to face the consequences. According to The National Plan for the Construction and Management of Flood Detention Basins, initially proposed by the Ministry of Water Resources in China, “residents in Flood Detention Basin counties make significant sacrifices to protect the collective social welfare and enhance overall economic resilience against floods.”
We study the benefits and costs of this policy, using nighttime light data and geo-located, detailed firm-level data. While individual-level outcomes, such as health and educational impacts, are important, the primary focus of this study is on the policy's macroeconomic outcomes.
Flood Detention Basins in China
China is the country with the most severe river flood risk in the world. According to the EM-DAT International Disaster Database, China ranks No.1 in terms of total river flood events, total river flood damages, and total affected populations from 2000 to 2017. An important feature of floods in China is that they disproportionately affect the country’s economically important regions, leading to substantial threats to the economy, as shown in Figure 1.
Figure 1 Flood risk and nighttime light in China
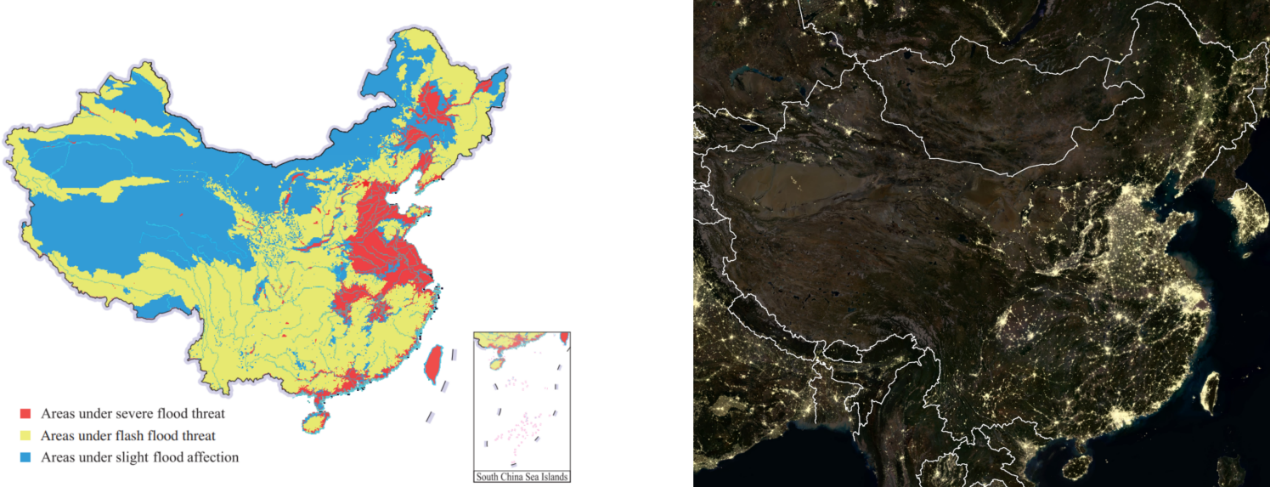
Notes: The left figure presents the flood risk map by Zhang and Song (2014), the right figure presents the nighttime light intensity map in China.
The Flood Control Law of the People’s Republic of China, implemented in 2000, stands as China’s first legislation governing flood management. According to the law, Flood Detention Basins refer to the flood storage and detention basins that are low-lying lands and lakes used for temporary storage of floods. The Chinese government then builds dams and dikes in those Flood Detention Basin counties so that the government can effectively divert flood water to Flood Detention Basins during floods. According to this plan, the goal of establishing flood detention basins is to “safeguard the interests of pivotal regions and the whole watershed”. The Huai River Basin is one example. Figure 2 shows how upstream Flood Detention Basin counties are protecting urban areas downstream.
Figure 2 Flood Detention Basin counties and protected areas in Huai River basin
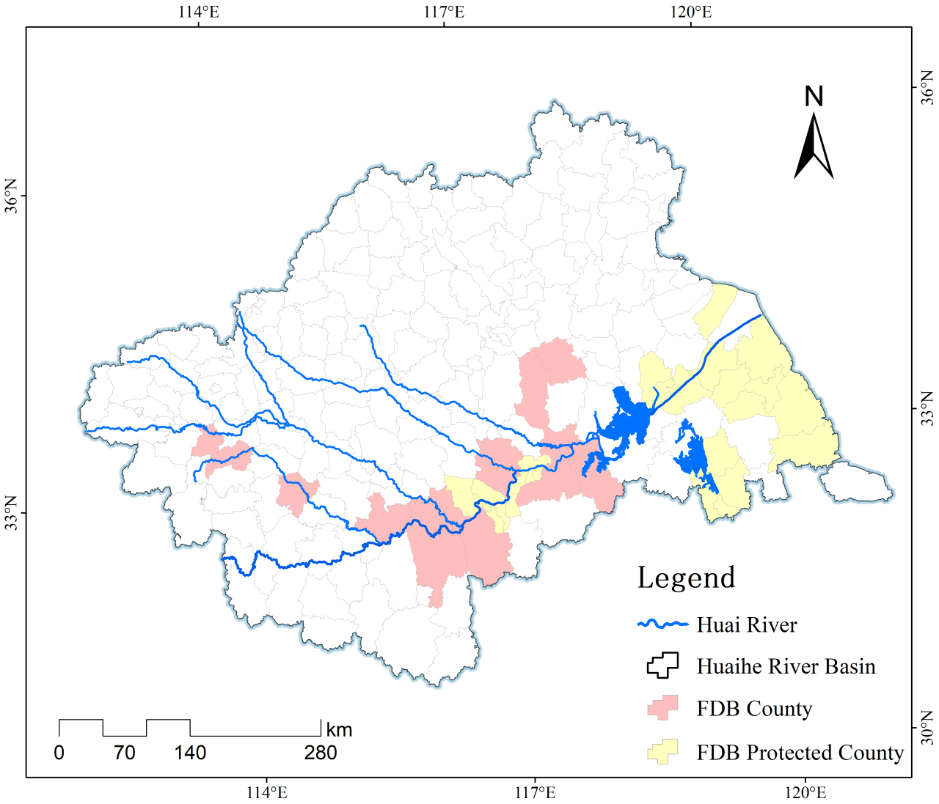
Notes: Huai River basin is a river basin of severe flood risk in China. ‘FDB County’ refers to counties that hold Flood Detention Basins. ‘FDB-protected County’ refers to areas that are protected by those Flood Detention Basin counties located in the upstream of the river basin.
How much did Flood Detention Basin counties sacrifice economically?
We find that being selected into the Flood Detention Basin list has caused persistent negative impacts on the economic development of Flood Detention Basin counties. Based on the difference-in-differences approach, we find that the nighttime light intensity in counties included in the 2000 Flood Detention Basin list has decreased by approximately 10% over a decade. Drawing on the work of Henderson et al. (2012) and Martinez (2022), which estimate the elasticity of GDP to nighttime light at approximately 0.3, we translate the reduction in light intensity to an annual GDP loss of around US$10 billion in FDB counties. This cost estimation also aligns with that by hydrologists (Wang et al. 2021).
Figure 3 Nighttime light intensity after designation of Flood Detention Basin counties
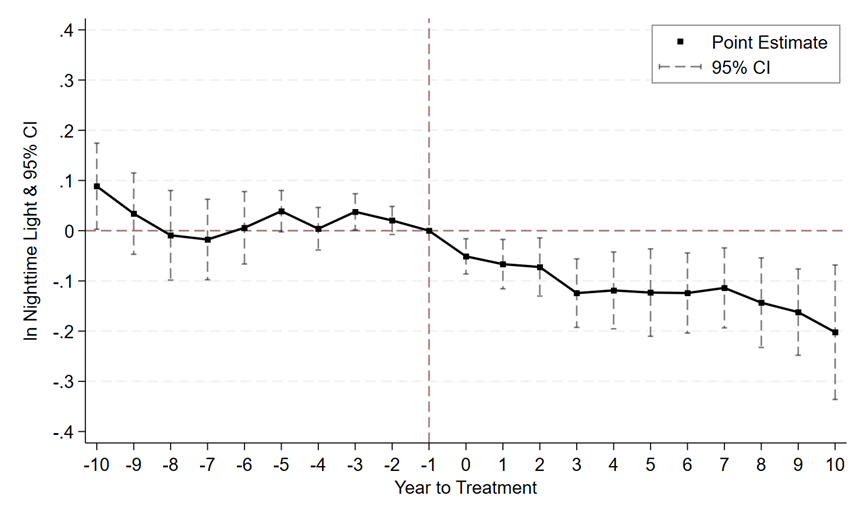
Note: This event study figure is plotted based on two-way fixed effect (TWFE) difference-in-differences approach. Before counties were designated as Flood Detention Basin counties, the difference between Flood Detention Basin counties and other counties is not significant. After counties were designated as Flood Detention Basin counties, we find that the nighttime light intensity in Flood Detention Basin counties decreased because of the policy.
We find that the ‘firm response effect’ is the major reason causing economic underdevelopment in Flood Detention Basin counties. Firms have less incentive to enter and invest in Flood Detention Basin counties due to their increased flood risks. Our results, using difference-in-differences analysis with synthetic weights (Arkhangelsky et al. 2021), show that, on average, the number of new firm entries declines by 15.9% in the newly selected Flood Detention Basin counties following the 2010 policy change. In contrast, we find that firms tend to re-enter counties if they are removed from the list.
Figure 4 Firm entry after 2010 Flood Detention Basin policy change
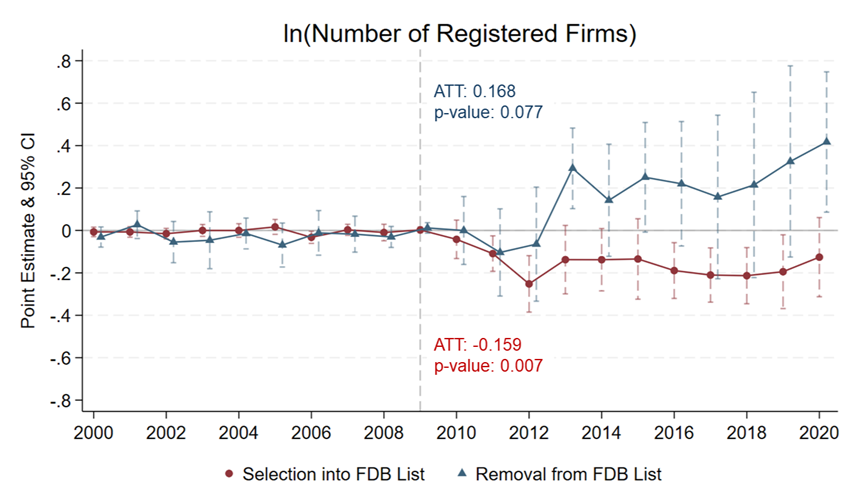
Note: This event study figure is plotted based on difference-in-differences (with synthetic weights) approach (Arkhangelsky 2021). In 2010, the Chinese government selected another 20 counties into the Flood Detention Basin list, and removed 10 from the Flood Detention Basin list. Based on this policy change, we study the impact of ‘Selection into FDB List’ and ‘Removal from FDB List’.
Did the Flood Detention Basin policy bring sufficient benefits to the economy?
We assess whether the Flood Detention Basin policy yielded an overall increase in total output by building a general equilibrium model and conducting a counterfactual analysis. The key parameter for our counterfactual practice is the flood exposure redistribution rate between Flood Detention Basin counties and non-Flood Detention Basin counties. In the absence of Flood Detention Basin, flood exposure in Flood Detention Basin counties would decrease, while exposure in protected areas would increase.
Focusing on the Huai River Basin, we use a hydro-dynamic engineering model to determine the actual exposure redistribution rate to be 45%. This rate indicates that flood exposure in Flood Detention Basin counties would decrease by 45% if those counties were not designated to absorb excessive floodwaters under the current policy. Based on that, we find that the benefit-to-cost ratio in output is 3.5.
Figure 5 Benefit-to-cost ratio of the Flood Detention Basin policy
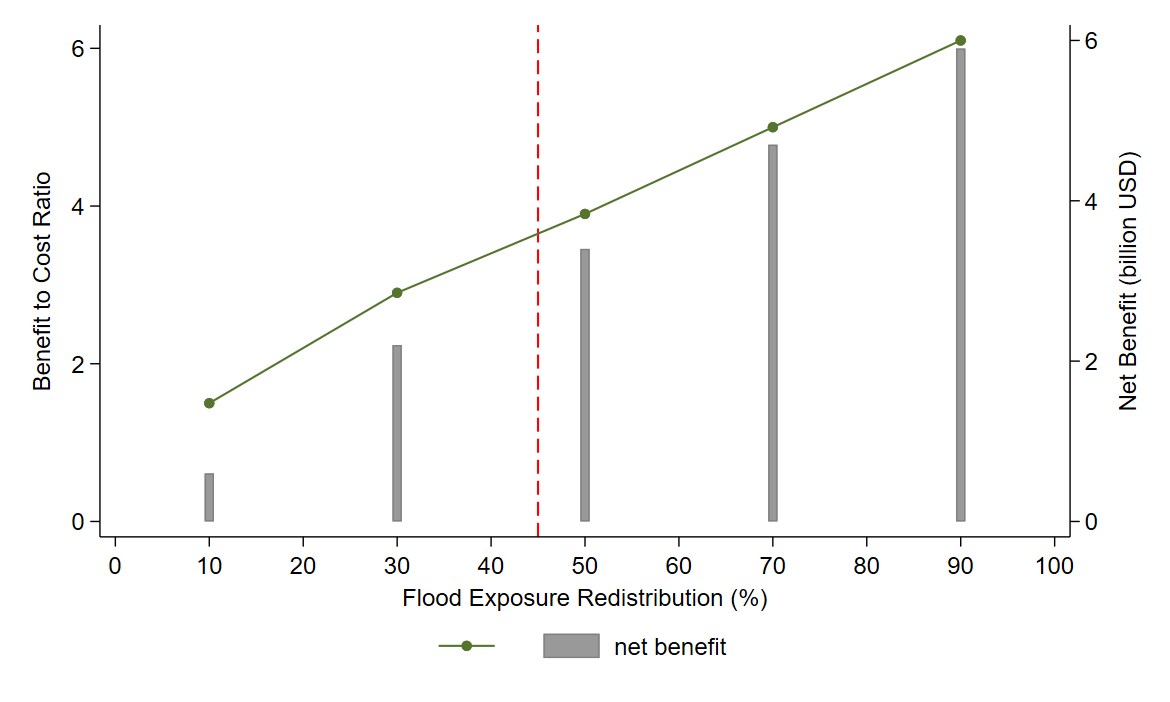
Note: ‘Flood Exposure Redistribution’ refers to the extent to which flood water would decrease in the absence of the Flood Detention Basin policy. We then calculate the benefit generated by the Flood Detention Basin policy given our counterfactual practices based on the spatial general equilibrium model.
Is the Chinese government overprotecting urban cities?
In our second counterfactual analysis, we first rank Flood Detention Basin counties based on their productivity levels and then assess their relative contributions to enhancing economic resilience against floods across different productivity tiers. As illustrated in Figure 6, counties with higher productivity levels contribute only marginally to the overall output gain. For instance, Flood Detention Basin counties in the top 85-100% range contribute only around 5% to the total output gain. This suggests that the Chinese government may be overprotecting urban areas from floods, as comparable output gains could be achieved by removing higher-productivity counties from the Flood Detention Basin designation.
Figure 6 Relative contribution of counties of different productivities
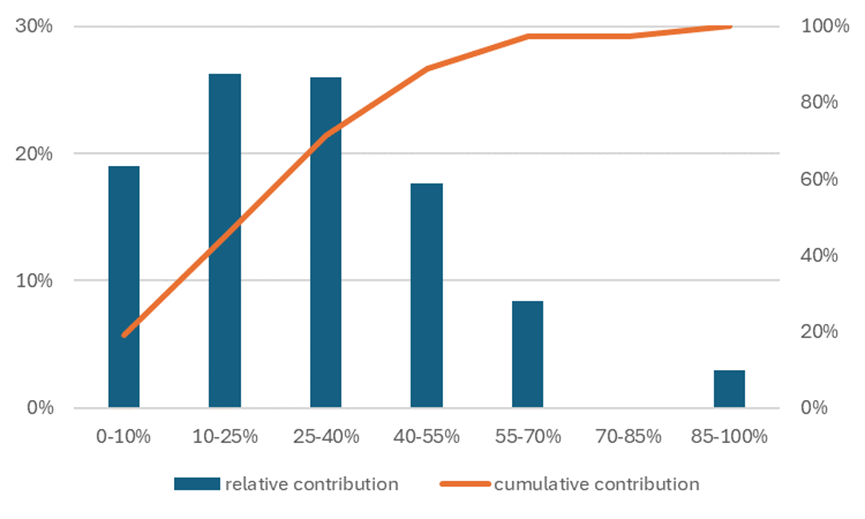
Note: Each bar represents the relative contribution of Flood Detention Basin counties of different productivity level.
Can Flood Detention Basin policies be an effective tool in managing flood risk?
We find that the Flood Detention Basin policy achieved its goal of improving economic resilience to floods in China, a country with the highest river flood risk in the world. However, Flood Detention Basin counties, which bear much higher flood risks because of intentional inundation, suffer an annual real GDP loss of approximately $10 billion.
In the era of climate change, managing floods has become a global issue. China’s case provides a useful reference point for other countries, especially those with both a high population density and high flood risk, in how to manage these risks. On the one hand, selectively choosing certain areas to bear more flood risks may improve the overall resilience towards floods. On the other hand, it is important for governments to consider measures that ensure environmental justice, such as issuing fiscal transfers from urban areas to rural regions designated to bear higher flood risks.
Editor's Note: For more on managing flood risk read the VoxDevLit on Climate Adaptation.
References
Arkhangelsky, D, S Athey, D A Hirshberg, G W Imbens and S Wager (2021), “Synthetic difference-in-differences,” American Economic Review.
Duflo, E, and R Pande (2007), “Dams,” The Quarterly Journal of Economics, 122(2): 601–646.
Fajgelbaum, P D, E Morales, J C Suárez Serrato, and O Zidar (2019), “State taxes and spatial misallocation,” The Review of Economic Studies, 86(1): 333–376.
Henderson, J V, A Storeygard, and D N Weil (2012), “Measuring economic growth from outer space,” American Economic Review, 102(2): 994–1028.
Martinez, L R (2022), “How much should we trust the dictator’s GDP growth estimates?” Journal of Political Economy, 130(10): 2731–2769.
Taylor, C A, and H Druckenmiller (2022), “Wetlands, flooding, and the clean water act,” American Economic Review, 112(4): 1334–1363.
Wang, K, Z Wang, K Liu, L Cheng, Y Bai, and G Jin (2021), “Optimizing flood diversion siting and its control strategy of detention basins: A case study of the Yangtze river, China,” Journal of Hydrology, 597: 126201.
Zhang, X, and Y Song (2014), “Optimization of wetland restoration siting and zoning in flood retention areas of river basins in China: A case study in Mengwa, Huaihe river basin,” Journal of Hydrology, 519: 80–93.