


China’s one-child policy increased its capital-labour ratio and reduced FDI inflows relative to India, consistent with neoclassical fundamentals
Foreign direct investment (FDI) flows are important for developing economies and emerging financial markets alike. Aside from being critical to exiting poverty traps (see, for example, Azariadis 1996), FDI is also important for accelerating the pace of economic development beyond what could be achieved through a country’s domestic savings and investment.
We examined the impact of demographic changes on FDI flows using China and India as case studies. Both developed (capital-exporting) and developing (capital-importing) countries have begun to experience population ageing. Because of its influence on capital/labour ratio dynamics and therefore the returns to capital, changing relative population growth rates have the potential to substantially alter the distribution of these capital flows. To test this assertion, we investigate the relationship between population ageing and FDI flows using a natural experiment which contrasts China’s mandatory one-child policy to India’s voluntary and broadly ineffective two-child policy.
We find that the skewed population distribution in China subsequent to the 1982 one-child implementation had a material impact on the relative FDI flows into China versus India, in favour of India. In Donaldson et al. (2018), we replicate these results in the context of a neoclassical overlapping-generations (OLG) model.1
Demographic trends in China and India
China and India are the two countries with the largest populations in the world. In India, a two-child birth regulation policy was voluntary and ineffective. In contrast, China's one-child policy was mandatory and effective.
Figure 1
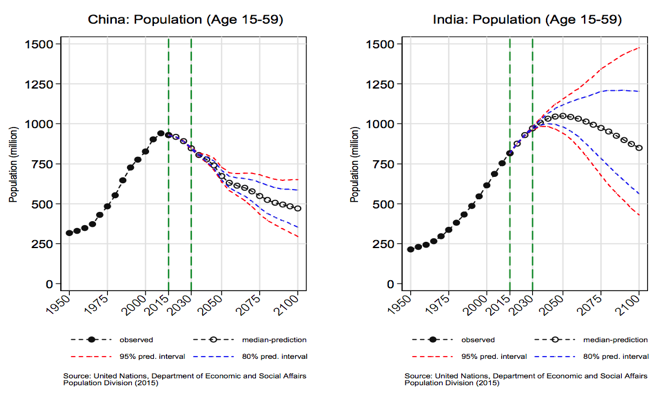
Figure 1 illustrates the differential impact of the two policies on the evolution of the respective populations of the two countries. In China, we observe an absolute decline in the working population (aged 15-59) starting in 2010 and predicted to continue under all reasonable scenarios; in India, on the other hand, the working population is predicted to continue growing, until at least 2030. After 2025, the working-aged population in India will exceed that of China. Clearly, China's policy intervention was not only effective almost immediately after implementation, but its effects are expected to persist beyond one generation.
Productivity and output trends in China and India
Table 1 provides data on the determinants of growth, productivity growth, and capital stock growth for China and India, as well as their respective real GDP growth rates, during the periods 1960-1981 and 1982-2014. These observations suggest that we may plausibly attribute trend differences between China and India, especially post 1982, to China’s exogenous demographic intervention.
Table 1 Annual growth rates (%) of macro aggregates
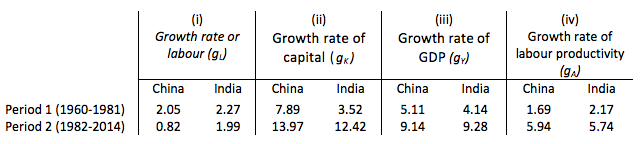
Source: Penn World Tables and United Nations.
As shown in Table 1, both China and India experienced very similar rapid GDP growth in the period after the implementation of the one-child policy in China (see column (i) of Table 1). Note that productivity growth, column (iv), was also similar in China and India, particularly in the post one-child intervention period. For both countries, growth was faster post 1982 than in the period 1960-1981. The capital stock grew slightly more rapidly in China relative to India in the latter period (1982-2014), while the dramatic slowdown in China’s labour force growth is clearly evident in the column (iii).
FDI-GDP ratio and capital-labour ratio dynamics (China vs India)
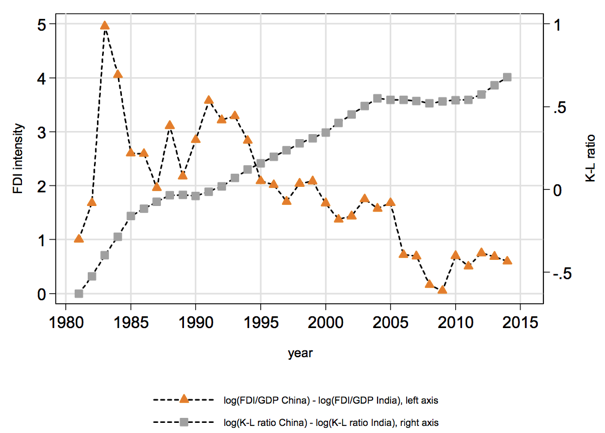
Figure 2 demonstrates that after the 1982 demographic intervention, the capital /labour (K/L) ratio of China grew more rapidly than that of India. During the same period, FDI intensity (measured by FDI as a share of GDP) grew faster in India than in China. Interestingly, in 1990, the intensity of FDI in China was about 30 times larger than that of India, but by 2014, the intensity of FDI in China had declined to less than 2 times that of India.
Figure 2 Post 1982, the K/L ratio of China grows faster than India
Decomposing the mechanism
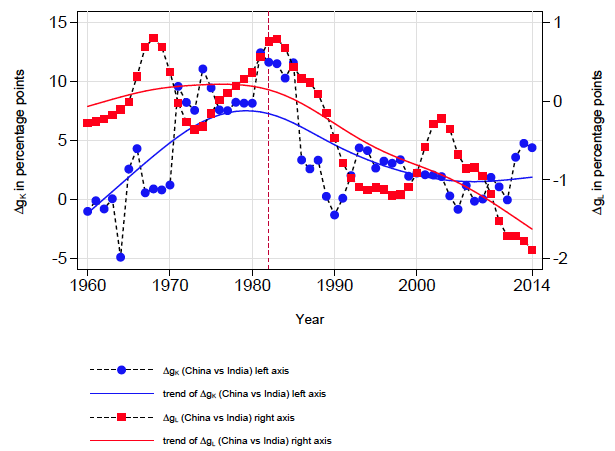
Figure 3 decomposes the growth effects presented in Figure 2. Note that the difference in capital growth rates between China and India (ΔgK = gK,China - gK,India) closely track the difference in labour growth rates between China and India (ΔgL = gL,China – gL,India). The one-child policy in China was an effective external (exogenous) demographic intervention, driving ΔgL down after 1982 (the red line in Figure 3). As a result, ΔgK (the blue line in Figure 3) also changed direction after 1982, closely tracking the changes in ΔgL. From Table 1, we know that ΔgA rose from -0.48% before 1982 to 0.20% after 1982. Such a rise in ΔgA is not, however, strong enough to mask the impact of population growth on capital growth.
The explanation for these effects is straightforward: the reduction in the (urban) labour force due to the one-child policy increases the savings per capita. Due to the reduction in labour and increase in capital, the capital- labour ratio increases and the returns to capital or the marginal product of capital (MPK) declines. This discourages further investment and FDI.
Figure 3 Differences in capital and labour growth rates between China and India
Inspecting the mechanism: Capital inflows track demographic changes
In Donaldson et al. (2018), we replicate these results in a three-country neoclassical OLG model.2 A key feature of the analysis is differential population (labour force) growth rates, and in particular, a sudden exogenous decline in the growth rate in one of the countries. This results in the national savings of the older generation accruing to a smaller younger generation, with a consequently higher capital-labour ratio which in turn leads to lower capital returns, discouraging FDI investment. If capital adjustment costs are present, the same phenomena are observed for a prolonged time. If saving rates do not drop more than the rate at which savings per young worker increase, then the trajectory of the capital growth differences between India and China closely tracks the difference in their respective population growth rates.3 Choukhmane et al. (2007) document a sharp rise in the Chinese saving rate after the policy had been implemented, giving empirical support to the analysis in Donaldson et al. (2018).
Conclusion
Demographics matter for explaining FDI transitions. To illustrate this phenomenon, we document the changing patterns of FDI flows into China relative to India that were observed subsequent to the implementation of China’s one-child policy, a policy that caused relative ageing of China’s population. With the resulting increase in China’s capital per worker vis-à-vis India’s, we observe the relative diminution of capital flows into that country.
Lucas (1990) demonstrated that the high marginal product of capital in poor countries relative to rich ones did not result in large FDI inflows, an apparent contradiction to standard neoclassical theory where capital should migrate to the location of its greatest return. We demonstrate that differences in population growth rates can substantially alter the pattern of relative FDI flows in the directions predicted by neoclassical theory.
References
Azariadis, C (1996), “The economics of poverty traps part one: Complete markets”, Journal of Economic Growth 1: 449-486.
Choukhmane, T, N Coeurdacier and K Jin (2017), “The one-child policy and household saving”, Mimeo, London School of Economics.
Donaldson, J B, C Koulovatianos, J Li and R Mehra (2018), “Demographics and FDI: Lessons from China's one-child policy”, NBER Working Paper 24256.
Lucas, R E Jr (1990), “Why doesn't capital flow from rich to poor countries?”, American Economic Review, Papers and Proceedings 80: 92-96.
United Nations (2015), “World population prospects: The 2015 revision”, Department of Economic and Social Affairs, Population Division, United Nations, ESA/P/WP.241.
Endnotes
[1] ‘Neoclassical’ OLG models assume competitive labour and capital markets, the international free flow of capital and diminishing marginal productivity in production. They also assume (the OLG feature) that different generations are present, just as young and old persons are present in the same family. Generations thus overlap. OLG models allow the researcher to explore the effects of changing population growth rates, and the changes in the age distribution of the population that they provoke, on equilibrium investment and capital per worker. Greater capital per worker indicates the increasing relative abundance of capital and thus lower capital returns.
[2] One of the countries is referred to as the Rest of the World (ROW) which is presumed to be the supplier of capital to two competing countries one of which we assume experiences a dramatic change in its population growth rate.
[3] With capital adjustment costs, which make it costly to alter capital per worker, the high capital labour ratio and low returns, persist for an extended duration. This is especially the case when the older generations does not dramatically diminish its saving despite its recognition that a smaller next-generation cohort will benefit.