


Frontier markets have significant potential for future growth and job creation, due to their large and rapidly growing populations, improving human capital, and increasing integration into international financial markets. However, their economic performance over the past 25 years has been uneven. Realising their potential will depend on carefully advancing financial development and integration, bolstering macroeconomic stability, and catalysing investment and productivity growth.
Frontier markets, a diverse group of economies tipped as the emerging markets of tomorrow, hold huge promise, most notably in terms of their demographics and access to international financial markets. Yet over the past 25 years, as a group, their economic performance has not fully delivered on this promise. Unlocking frontier markets’ potential will be important for global job creation, private capital mobilisation, and broader development progress.
What is a frontier market?
The term ‘frontier market’ was coined by the World Bank Group’s International Finance Corporation in the early 1990s. Since then, the descriptor has become widely used in financial markets, and it generally refers to ‘pre-emerging economies’: those with some degree of market access, but to a lesser degree than emerging markets. Yet precise definitions vary, and there has been little systematic economic analysis of these countries as a group. Using a composite of financial market index providers’ classifications, World Bank (2026) identifies 39 frontier markets as of 2012, increasing to 56 by 2025.
This analysis considers frontier markets’ characteristics and their economic performance over the last quarter century. These frontier markets, while mostly middle-income countries, are diverse in terms of geography, populations, and output per capita (Figure 1). Examples range from Azerbaijan to Vietnam, and from Bangladesh to Zambia. Frontier markets will be at the forefront of efforts to mobilise private capital, which, given declining Official Development Assistance flows, will be key to global development prospects in the years ahead. Demographic trends mean that frontier markets will also be pivotal to global job creation efforts.
Figure 1. Basic characteristics of frontier markets
A. Frontier markets by region B. Frontier markets’ GDP per capita and population
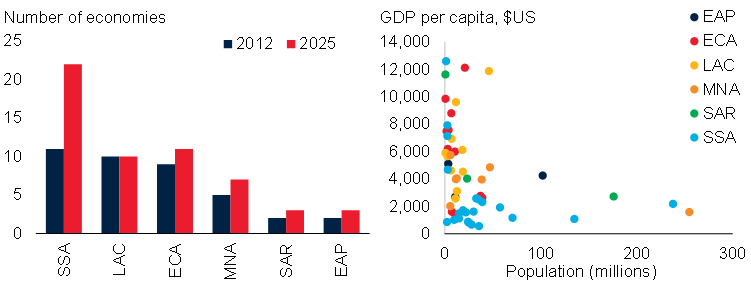
Note: EAP = East Asia and Pacific; ECA = Europe and Central Asia; FM = frontier markets; LAC = Latin America and the Caribbean; MNA = Middle East, North Africa, Afghanistan and Pakistan; SAR = South Asia; SSA = Sub-Saharan Africa. A. Sample includes 39 FMs in baseline 2012 classification, and 56 FMs as of 2025 classifications. B. Panel shows FM economies’ real GDP per capita and population in millions, both estimated, for 2025. Sample includes 56 FMs. Sources: UN Population Prospects (database); World Bank.
What is the promise of frontier markets?
By virtue of their inclusion in key international equity and bond indexes, frontier markets are well-placed to attract international capital flows, including directly via index investing strategies. Their levels of financial openness have improved. Today’s frontier markets account for only 5% of global GDP. Yet they are already home to over one-fifth of the world’s population, and between 2025 and 2050, their populations are projected to grow by more than the rest of the world combined (Figure 2A).
Frontier markets also tend to have better health and education levels than other developing economies (albeit not as good as in the typical emerging market) (Figure 2B). Many of these economies also have significant natural resource endowments, which, if developed effectively, could help support economic development.
Figure 2. Frontier markets’ promise
A. Shares of global population and GDP B. Capital stock per head and schooling
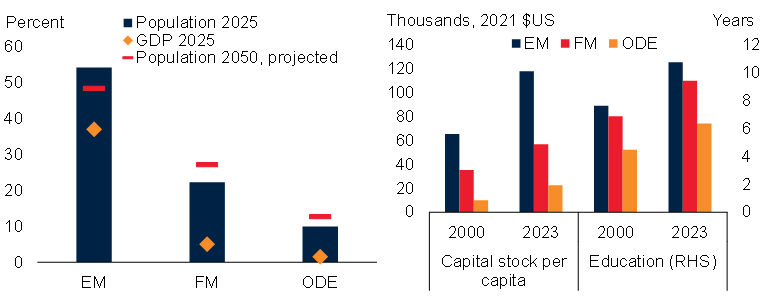
Note: EM = emerging markets; FM = frontier markets; ODE = other developing economies, neither EM nor FM. A. Sample includes 37 EMs, 56 FMs, and 57 ODEs, by 2025 classifications. B. Left-hand side shows median value of capital stock per capita per country group. Sample includes 34 EMs, 39 FMs, and 63 ODEs. Right-hand side shows median of mean years of schooling within each group. Sample includes up to 34 EMs, 39 FMs, and 70 ODEs. Sources: Feenstra, Inklaar, and Timmer (2015); UN Population Prospects (database); WDI (database); World Bank.
How have frontier markets performed?
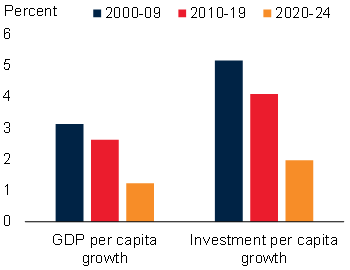
Despite this clear promise, frontier markets’ macroeconomic performance over the past quarter century has been mixed. Like other emerging market and developing economies, per capita rates of growth and investment have both more than halved since the 2000s (Figure 3A). Inflation has tended to be higher than in emerging markets. Government debt levels have risen, including foreign currency-denominated debt. Almost 40% of frontier markets have experienced a sovereign default or restructuring so far this century (Figure 3B). These events have become more frequent in recent years, and in the five years from 2020, frontier markets saw more defaults than the rest of the world combined.
Figure 3. Frontier markets’ headline macroeconomic performance
A. Annual GDP and investment growth in frontier markets
B. 2000–2024 sovereign defaults across country groups
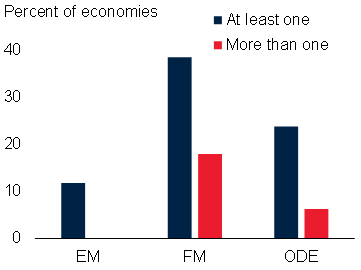
Note: EM = emerging markets; FM = frontier markets; ODE = other developing economies, neither EM nor FM. Samples are based on the 2012 baseline groupings outlined in the chapter. A. Bars show average annual growth of GDP and investment per capita in frontier markets. Sample includes 38 FMs for GDP per capita growth series and 34 FMs for investment per capita growth series. B. An event is considered a sovereign default or restructuring when a) a country misses a payment to creditors beyond the grace period, or b) debt is restructured at terms less favourable for creditors than the original contract. All events considered here involve private creditors. Defaults of Belarus, Mali, Niger, and Russia are not included because the events were related to sanctions. When more than one default event takes place in a single economy within two years, the events are bundled into one episode. The defaults of República Bolivariana de Venezuela are excluded due to lack of accompanying economic data around the time of default. Data covers events that occurred between 2000 and 2024. Sources: Asonuma and Trebesch (2016); Erce, Mallucci, and Picarelli (2022); Feenstra, Inklaar, and Timmer (2015); Fitch ratings (2025); Moody’s Ratings (2025); S&P Global (2025); UN Population Prospects (database); WDI (database); World Bank.
However, frontier markets as a group have made steps forward in some areas. Their share of global capital flows increased in the 2000s. Their legal frameworks have become significantly more open to capital from abroad. Poverty rates have halved since 2000, although progress has tailed off in recent years. People living in frontier markets have completed more years of schooling and have longer life expectancies than they did in 2000, although gaps persist relative to emerging markets.
Moreover, some frontier markets have registered notably stronger economic performance over the last quarter century. Among these faster-growing economies, growth engines have varied: some have pursued value-added manufacturing, some infrastructure and energy sector development, and some tourism – very different sectors, but all among those identified by the World Bank Group as holding strong potential for resilient job creation. Despite these differing routes to growth, some common themes emerge. Faster-growing frontier markets have also tended to record much stronger investment growth (Figure 4A). They have recorded greater improvements in governance than other frontier markets. They have also done a better job of containing rises in government debt (Figure 4B).
Figure 4. Faster-growing frontier markets’ macroeconomic performance
A. Annual GDP and investment growth B. Government debt
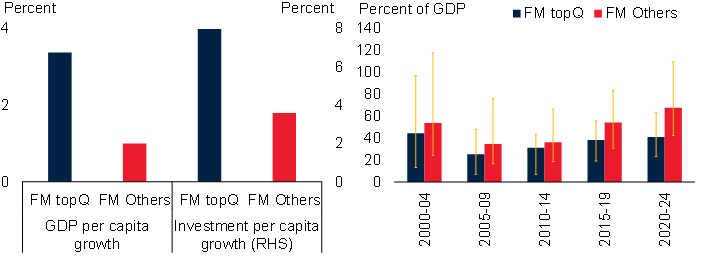
Note: FM topQ = frontier markets in the top quartile for average per capita GDP growth over 2000–24; FM Others = remaining frontier markets in the sample. This captures economies that were frontier markets in 2012 and those that have subsequently achieved frontier market status. A. Bars show annual average over 2000–24. Sample includes 15 FM topQ and 47 FM Others for output per capita, and 11 FM topQ and 39 FM Others for investment growth per capita. B. Bars represent period averages of median values of government debt as a percentage of GDP for each group. Whiskers show the 10th and 90th percentiles. Data for 2024 is an estimate. Sample includes up to 15 FM topQ and 47 FM Others. Sources: Kose et al. (2022); WDI (database); World Bank.
What next for frontier markets?
If they can harness their potential, frontier markets are well-placed to become the next generation of emerging markets, delivering strong growth and development outcomes. Frontier markets have a strong platform, but also face a challenging external environment and must manage vulnerabilities, sometimes with limited capacity; support from the international community will be important. The extent to which frontier markets can deliver on their potential will increasingly shape global job creation and development outcomes.
A multi-faceted policy approach is likely to be necessary, and lessons from the experiences of faster-growing frontier markets provide some insight. Advancing financial integration while improving oversight capacity, developing local financial markets, and enhancing policy buffers can help harness investment. Expanding and diversifying exports can support resilience and development. Bolstering macroeconomic stability and policy credibility can provide a platform for effective financial integration. Catalysing investment and productivity growth, including via strong foundational infrastructure, is essential to helping frontier markets capitalise on their market access, demographic potential, and resource endowments.
For further details, see the World Bank’s report on Frontier Market Economies: Promise, Performance, and Prospects.
References
Asonuma, T, and C Trebesch (2016), “Sovereign restructurings: Pre-emptive or post-default,” Journal of the European Economic Association, 14(1): 175–214.
Erce, A, E Mallucci, and M Picarelli (2022), “A journey in the history of sovereign defaults on domestic-law public debt,” Unpublished manuscript.
Feenstra, R, R Inklaar, and M Timmer (2015), “The next generation of the Penn World Table,” American Economic Review, 105(10): 3150–3182.
Kose, M A, S Kurlat, F Ohnsorge, and N Sugawara (2022), “A cross-country database of fiscal space,” Journal of International Money and Finance, 128: 102682.
World Bank (2026), “Frontier market economies: Promise, performance, and prospects,” Global Economic Prospects, Chapter 4, World Bank.