

Education has been a major driver of global growth and poverty reduction since 1980, accounting for nearly half of overall income gains – boosting productivity while reducing inequality and making public schooling a key engine of poverty reduction.
In recent decades, there has been a dramatic reduction in the share of the world’s population living in extreme poverty (Lakner et al. 2016, Armentano et al. 2025). This trend is now well-documented, yet its causes remain poorly understood. Among potential drivers, the progress made in education has been spectacular. Yet it remains difficult to determine the extent to which education has contributed to global poverty reduction. The economic impact of schooling depends on who gains access, the returns to education, and broader general equilibrium effects. Because these channels are hard to quantify, we lack reliable estimates on the benefits of schooling for the poor. Closing this gap is crucial for policymaking, especially given that most children from low-income households attend public schools.
In recent work (Gethin 2025), I construct new estimates of the aggregate and distributional effects of global educational expansion between 1980 and 2019. Drawing on a micro-level database spanning 154 countries, I employ a ‘distributional growth accounting’ approach – linking education and wage structure – alongside complementary quasi-experimental evidence. This allows me to quantify the contribution of schooling to economic growth across different segments of the global income distribution. I find that education has accounted for a substantial share of global economic growth and the decline in extreme poverty since 1980, highlighting the role of public education policies in driving economic progress.
Distributional growth accounting
I estimate the impact of education on global growth and inequality by combining three new methodological ingredients.
The first ingredient is a ‘distributional growth accounting’ model of education and wage structure, following Goldin and Katz (2008). In this framework, workers are imperfectly substitutable: the return to schooling and relative wage of skilled workers depend on their relative supply. This has two key implications:
- The contribution of education to growth exceeds what a standard growth accounting decomposition would suggest. This is because returns to schooling would be higher today had education not expanded, given the smaller supply of skilled workers. Consequently, reverting education to its 1980 levels would imply a greater loss in output than what 2019 returns to schooling suggest.
- Education reduces inequality: increasing the relative supply of skilled workers reduces their relative wage. As a result, because of supply effects, low-income earners indirectly benefit from educational expansion even when they did not receive more education themselves.
Second, I bring this framework to the data by compiling a new micro database on education and earnings representative of 97% of the world’s population. It is based on household surveys fielded in 154 countries around 2019, collected from various data repositories and country-specific sources. This database allows me to observe the joint distribution of education and income and to estimate the returns to schooling in each country. As shown in Figure 1, there are large variations in returns to schooling by education level and around the world. Returns to schooling are generally convex: they are larger at higher levels of education.
Figure 1: Return to schooling around the world
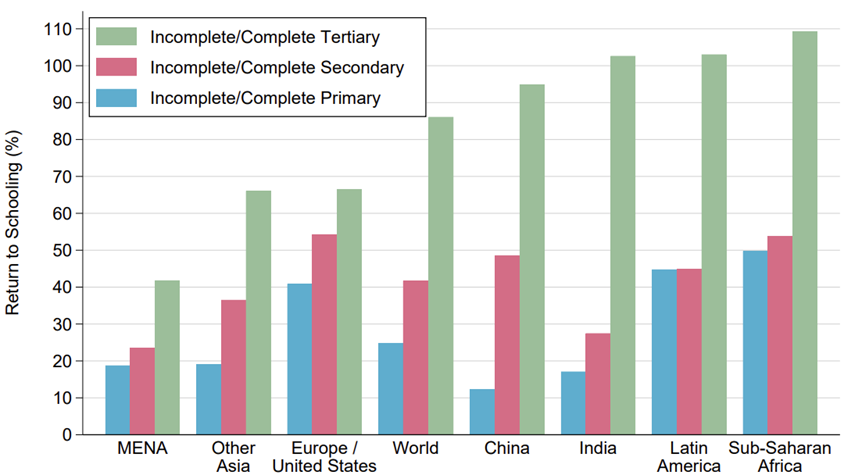
Notes: The figure plots the returns to schooling by education level and world region. Interpretation: in the average Sub-Saharan African country, having incomplete or complete primary education increases earnings by 50%, incomplete or complete secondary education further increases earnings by an additional 55%, and incomplete or complete tertiary education further increases earnings by an additional 110%.
The third ingredient consists of three in-depth case studies of education policies implemented in Indonesia, India, and the US, which I use as a validation exercise. Figure 1 illustrates the results in the context of Indonesia’s 1970s school construction programme, which has received considerable attention in economic research (Duflo 2001, Akresh et al. 2023). I find that the policy led to large aggregate income gains, which were disproportionately concentrated among low-income groups. The model reproduces these findings with a good degree of accuracy, providing a methodological foundation to study the aggregate and distributional effects of education.
Figure 2: Actual versus simulated distributional effects of Indonesia’s INPRES school construction programme
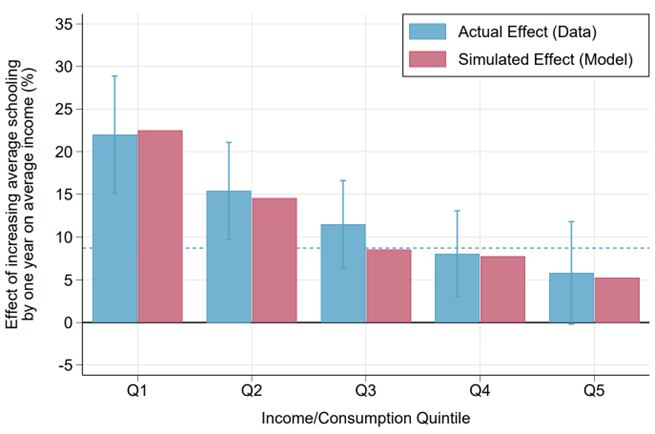
Notes: The figure compares actual causal effects of educational expansion on the average income of each quintile with simulated effects predicted by the model. Capped spikes correspond to 95% confidence intervals. The dashed line shows the estimated effect of average regional years of schooling on the average income. Estimates combine SUSENAS 1993-2019 microdata with INPRES programme intensity from Duflo (2001). Interpretation: a one-year increase in average years of schooling of the working-age population is associated with a 20-25% increase in average income among the poorest 20%.
Combining the data and model, I quantify the contribution of education to real income growth for different groups of the global income distribution. I do so by constructing a counterfactual world distribution of income – that is, by calculating how much lower incomes would be today had education not improved, holding all other factors of production constant at their observed trajectories. I then compare this counterfactual distribution with the observed evolution of global incomes, allowing me to estimate the contribution of education to growth across different income groups within each country.
Education and global poverty reduction
I find that education has played a major role in the reduction of global poverty and inequality. Figure 3 plots real annual income growth for all individuals in the world, ranked from the poorest 1% to the richest 0.01%. The lower shaded area shows growth explained by education. The upper shaded area shows residual growth coming from other factors (such as physical capital or technology).
Real income gains have been greatest at the middle and very top of the global income distribution, generating what has often been referred to as the ‘elephant curve’ of global inequality and growth (Lakner and Milanovic 2016). This pattern reflects the conjunction of trends in inequality between and within countries, including the rise of China and India (middle of the distribution), sluggish economic growth in low-income countries (bottom of the distribution), weak income gains for most households living in high-income countries (upper middle of the distribution), and skyrocketing top income inequality in many parts of the world (top end of the distribution).
The gains from education have been enormous. As shown by the lower shaded area, education has accounted for around 45% of global economic growth and 60% of income gains among the poorest 20% of individuals since 1980. It can also explain around one-third of the reduction in the share of the world’s population living in extreme poverty.
Figure 3: Education and the distribution of global economic growth (1980–2019)
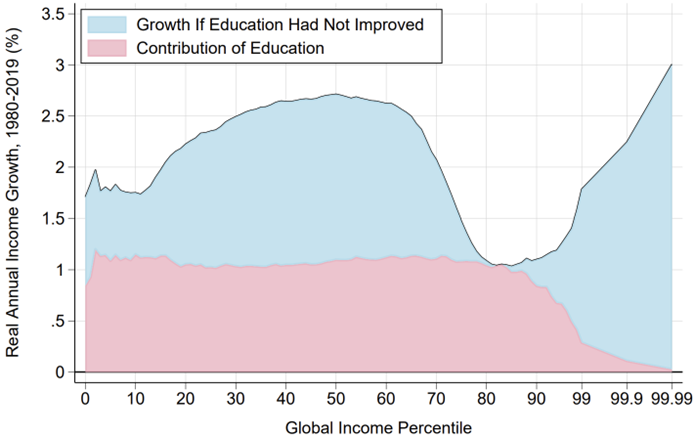
Notes: The figure plots total real annual income growth by global income percentile from 1980 to 2019, decomposing it into a part that can be explained by private returns to schooling and an unexplained component. The upper shaded area represents the growth rates that would have prevailed absent any improvement in the education of the world’s working-age population since 1980. The lower shaded area represents the corresponding contribution of education to economic growth. Taking the ratio between this contribution and actual growth rates, education explains around 60% of growth for the 20% poorest individuals. The income concept is pre-tax income per capita.
Methodologically, accounting for the effects of education on inequality within countries is essential. Because education increases the supply of skilled workers, it reduces their relative wage while increasing that of low-skilled workers. Ignoring this channel would strongly underestimate the benefits of education for the global poor. In other words, researchers and policymakers interested in reducing extreme poverty should account for the distributional effects of schooling policies when evaluating potential economic benefits.
Policy implications: Poverty reduction and economic growth
Education has been, and will likely remain, a major driver of poverty reduction and inclusive growth. Not only does schooling improve productivity, it also enables growth to be broadly shared by redirecting economic gains from newly skilled to less skilled workers. Expanding access to schooling, especially for the most vulnerable households, should thus be seen as a priority for policymakers in the decades to come. In doing so, it is important to keep two implications in mind:
- While the overall effects of education have been positive, the returns to schooling vary enormously across countries. Research suggests that both education quality and the structure of labour markets strongly shape the benefits of education, with labour demand factors playing a particularly important role (Rossi 2022). Schooling and labour market policies should go hand in hand.
- Evidence suggests that returns to schooling are often larger at higher levels of education. Very large returns to tertiary education often result from high-skilled workers being in high demand, enabling them to extract a particularly large surplus. In that context, developing higher education may generate large benefits to the newly skilled while also reducing inequality by pushing down the relative wage of the already skilled. In certain contexts, expanding access to tertiary education may thus be beneficial both for equity and efficiency, including in developing countries.
References
Akresh, R, D Halim, and M Kleemans (2023), “Long-term and intergenerational effects of education: Evidence from school construction in Indonesia,” Economic Journal 133(650): 582–612.
Armentano, V, P Niehaus, and T Vogl (2025), “How poverty fell.”
Duflo, E (2001), “Schooling and labor market consequences of school construction in Indonesia: Evidence from an unusual policy experiment,” American Economic Review 91(4): 795–813.
Gethin, A (2025), “Distributional growth accounting: Education and the reduction of global poverty, 1980–2019,” The Quarterly Journal of Economics, qjaf033.
Goldin, C, and L F Katz (2008), “The race between education and technology,” Harvard University Press.
Lakner, C, M Negre, and J Cuesta (2016), “Know your facts: Poverty numbers,” VoxEU.
Lakner, C, and B Milanovic (2016), “Global income distribution: From the fall of the Berlin Wall to the Great Recession,” World Bank Economic Review 30(2): 203–232.
Rossi (2022), “The relative efficiency of skilled labor across countries: Measurement and interpretation,” American Economic Review 112(1): 236–66.