


A timely assessment of current economic conditions is obtained by extracting common signals from high-frequency official macroeconomic indicators. This approach performs well even in data-scarce settings, serving as a blueprint for economic forecasts in low-income countries. Evidence from Kenya showcases the contribution of trade, production, consumption, and digital payments to economic growth fluctuations.
Reliable and timely information on economic activity is essential for sound macroeconomic policymaking. Yet, in many low-income countries (LICs), policymakers must often rely on incoming data that is published infrequently and with long delays. GDP, the most comprehensive measure of economic activity, is typically released several months after the end of the reference period, limiting the ability of authorities to steer the economy in real time and respond swiftly to emerging shocks.
Kenya serves as a good illustration. The country ranks among the top LIC performers for the quality of its macroeconomic statistics, having published quarterly GDP since 2009. Even so, publication lags remain significant, with GDP figures released more than three months after the end of the quarter, much later than the one-month delay typically observed in advanced economies (Figure 1). Frequent data revisions – also observed in advanced economies – further delay the effective release date of final GDP data, thereby increasing the actual publication lags. This delay complicates the real-time assessment of economic conditions, especially during periods of heightened uncertainty.
Figure 1: Data publication delays
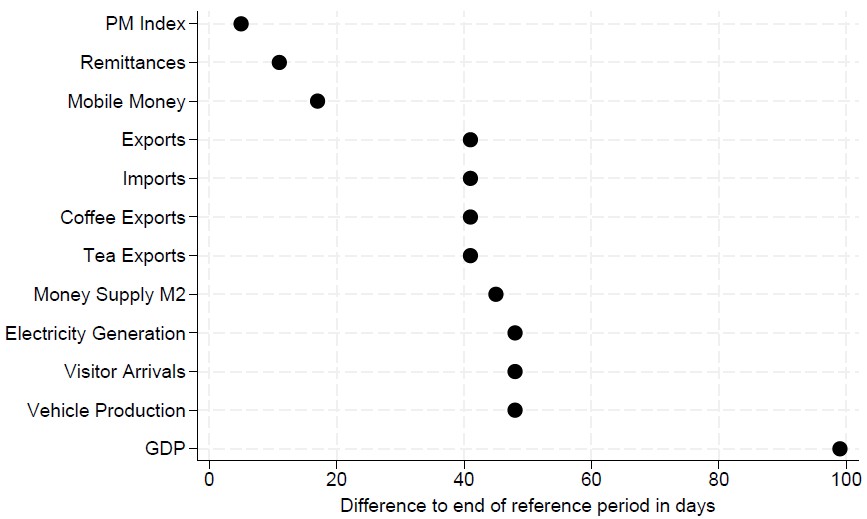
Notes: Data is collected from Central Bank of Kenya, Kenya Power & Lighting Company, Kenya National Bureau of Statistics, and Kenya Tourism Board. Black dots show the number of days between the reference end-period and release date of each economic activity indicator.
Our recent research develops and evaluates a nowcasting framework for Kenya that produces real-time estimates of quarterly GDP growth using monthly indicators and digital transaction data (Danov, Giannone, Kabundi, Okou, and Spilimbergo 2026). We show that even in a data-constrained environment, a transparent and fully automated model can deliver timely and accurate assessments of current economic conditions – comparable to forecasts produced by institutions relying on both models and judgement.
What is nowcasting, and why does it matter for low-income countries?
Nowcasting exploits the fact that many economic indicators move together over the business cycle (Giannone et al. 2008). Instead of waiting for quarterly GDP to be published, a statistical model extracts the common signal from timely monthly data, such as trade flows, electricity production, or non-traditional transaction data, to infer how the economy is performing in real time (Figure 2).
This approach is widely used in advanced and large emerging economies, but much less so in low-income countries, where data constraints are more severe (Banbura et al. 2013, Cascaldi-Garcia et al. 2024). Paradoxically, timely information is most valuable in LICs where economic activity is often more exposed to external shocks, domestic market disruptions, extreme weather events, institutional fragility – and where policy buffers tend to be limited (Kose et al. 2003).
Kenya provides a compelling testing ground. While official data availability is more limited than in advanced economies, several key indicators are published monthly and closely monitored by policymakers and markets. These include imports and exports of goods – in particular coffee and tea, electricity generation, vehicle production, visitor arrivals, remittances, and increasingly digital mobile money transactions that underpin cashless transactions in both the formal and informal sectors.
Figure 2: Standardised data and signal (Units of standard deviation)
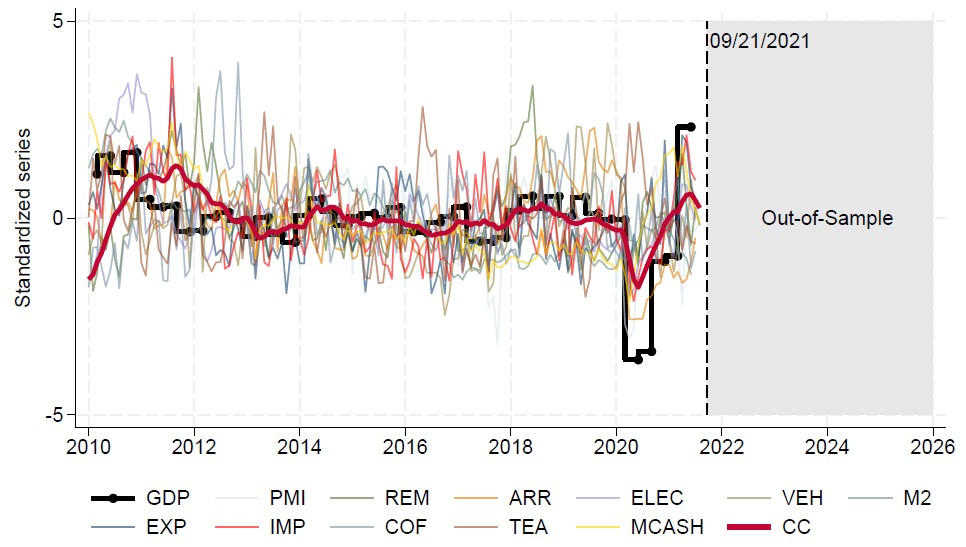
Notes: Data is collected from Central Bank of Kenya, Kenya Power & Lighting Company, Kenya National Bureau of Statistics, and Kenya Tourism Board. The chart plots a stepwise monthly representation of standardised quarterly GDP growth alongside standardised monthly predictor series and the estimated monthly common component using a two-factor dynamic factor model. PMI = Stanbic Bank Kenya PMI; REM = Diaspora Remittances; ARR = Visitor Arrivals; ELEC = Electricity Production; VEH = Vehicle Production; M2 = Money Supply; EXP = Exports of Goods; IMP = Imports of Goods; COF = Exports of Coffee; TEA = Exports of Tea; MCASH = Mobile Money; GDP = Real GDP; CC = Common Component or “Signal” from a two-factor dynamic factor model.
A simple but powerful modelling framework
To address these challenges, our approach uses a dynamic factor model (DFM), which summarises the information from a broad set of monthly indicators into a small number of latent factors that capture aggregate economic conditions (Doz et al. 2012, Banbura and Modugno 2014, Stock and Watson 2016). The model is regularly updated to incorporate new information immediately as it becomes available.
Crucially, our full prediction framework allows us not only to update GDP estimates in real time, but also to decompose each revision into ‘news’ components. In other words, we can identify which data releases – such as weaker-than-expected imports or a surprise drop in digital payments – are driving changes in the GDP nowcast. This feature makes the model particularly transparent, making it easy to interpret what is driving each revision and providing useful insights for policy analysis.
What drives Kenya’s GDP nowcasts?
Three results stand out.
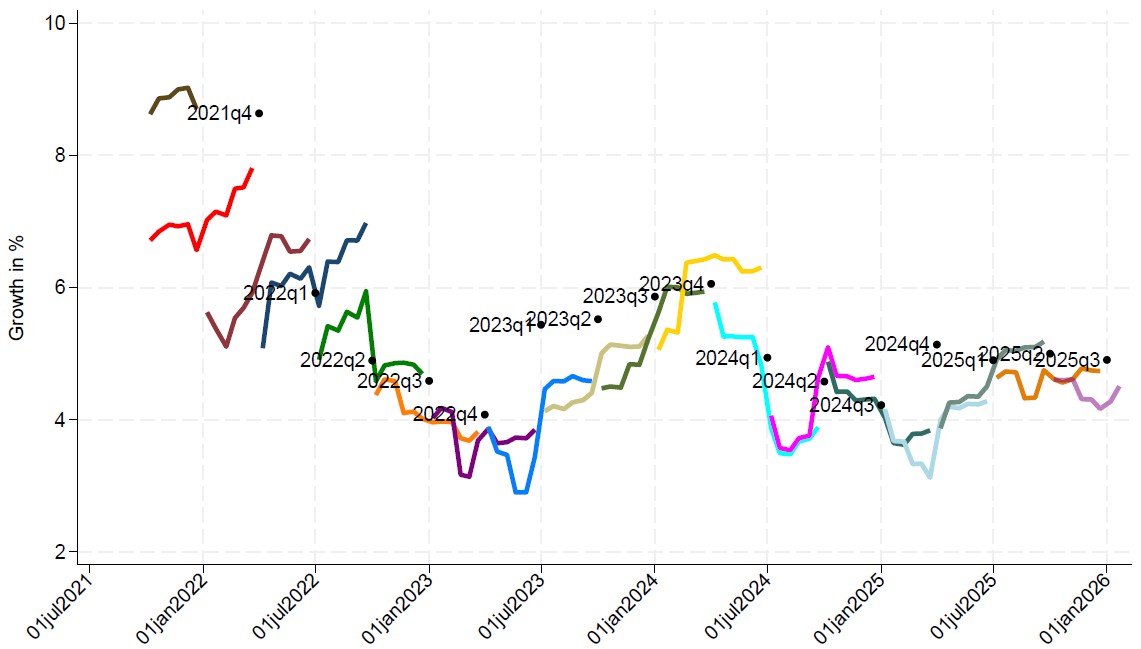
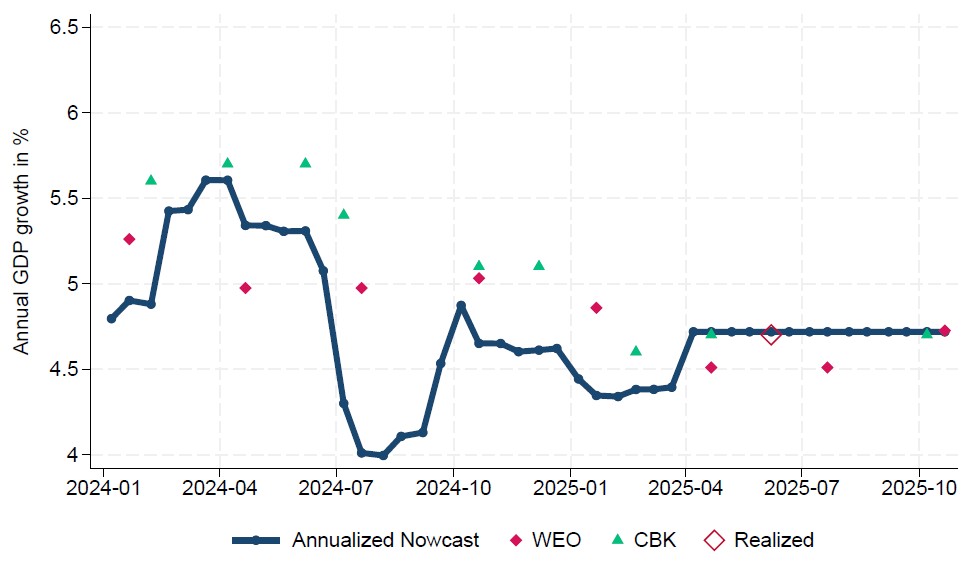
First, the model performs well despite Kenya’s data constraints. Real-time nowcasts track actual GDP growth closely and become more accurate as the official GDP release approaches (Figure 3a-b). Importantly, our DFM forecasts – based purely on data and without judgment – are competitive with institutional forecasts produced by the Central Bank of Kenya and the IMF.
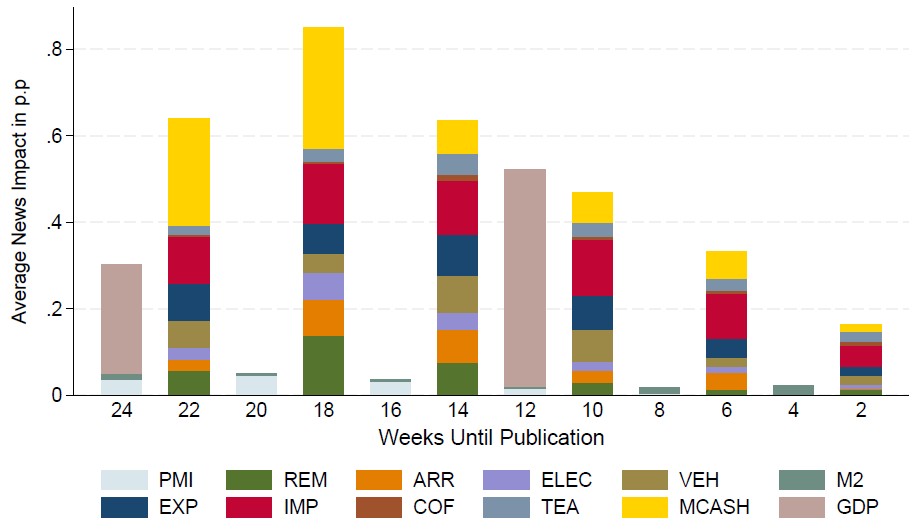
Second, trade, production, and consumption indicators play a central role in explaining movements in GDP (Figure 3c). News related to exports and imports of goods, electricity generation, and vehicle production consistently account for a large share of GDP nowcast revisions. This finding aligns with the broader evidence that trade shocks are a dominant driver of business cycles in LICs.
Third, digital payments data provide valuable and timely information (Figure 3c). Kenya is a global leader in mobile money adoption, with more than 85% of adults using digital financial services. We find that surprises in mobile money transactions, particularly their value, have a sizeable impact on GDP nowcasts, especially early in the quarter when traditional data is still sparse. Beyond formal private consumption, this data also appears to capture changes in informal-sector activity that are not immediately visible in standard macroeconomic statistics.
Why timeliness matters
One striking pattern is that the most informative data tends to arrive in the middle of the nowcasting window. Very early in the quarter, signals for GDP growth are still weak, whereas most incoming information has already been incorporated towards the end of the quarter, pending potential data revisions. Monthly indicators released with short delays – such as purchasing managers’ surveys or digital payments – are therefore especially useful in shaping early assessments of economic conditions (Figure 3d).
By contrast, official GDP releases have a large but mechanical effect: once they arrive, they sharply shift estimates of the recent past and help anchor forecasts for subsequent quarters.
Figure 3: Nowcast of GDP Growth
(a) Evolution of annualised nowcasts 2021–2025
(b) Nowcast of annual GDP growth for 2024
(c) Average impacts of data releases in 2021–2025
(d) Nowcast revisions and news for 2025Q3
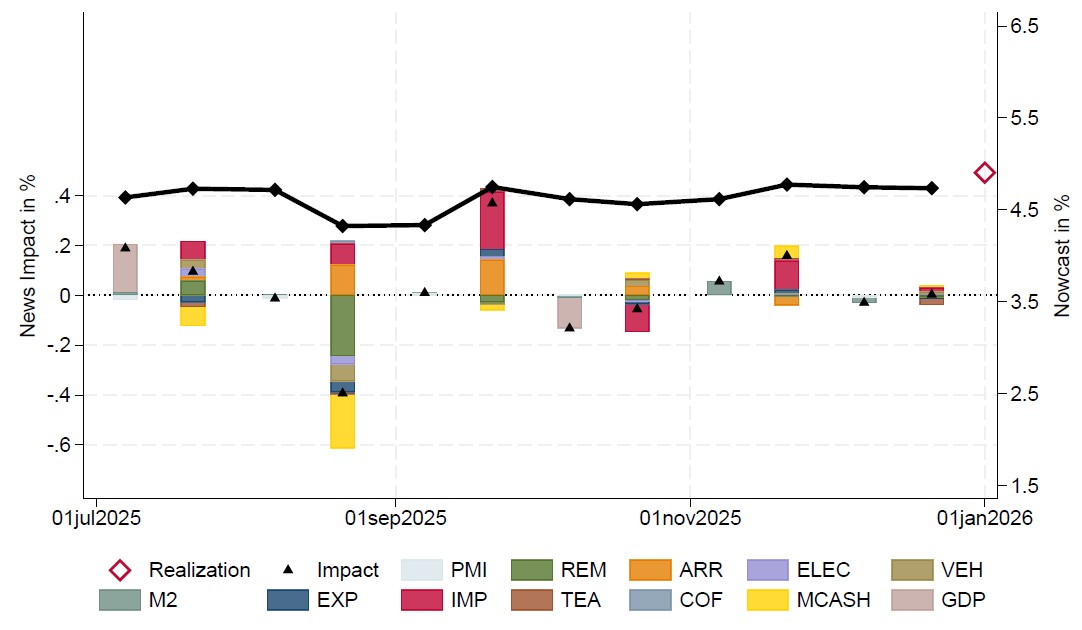
Notes: Data is collected from Central Bank of Kenya; Kenya Power & Lighting Company; Kenya National Bureau of Statistics; and Kenya Tourism Board. GDP release dates follow the official release calendar and nowcasts are constructed using the two-factor dynamic factor model. Panel (a) depicts the evolution (solid line) of GDP growth nowcasts for different quarters. The dots indicate the publication of official GDP data, and each line traces how the nowcast evolves as new information becomes available. Panel (b) shows the evolution of annualised quarterly GDP growth nowcasts. Annual (realised) GDP growth is measured as the year-over-year change. Annual nowcasts are constructed by aggregating quarterly forecasts, which are updated on a bimonthly basis. CBK = Forecasts from the Central Bank of Kenya; WEO = Forecasts from the IMF World Economic Outlook. In Panel (c), coloured bars represent the average absolute impact of each macroeconomic variable on the nowcast estimated based on a two-factor model. The horizontal axis indicates the timing of the nowcasts within the quarter, measured by the number of bimonthly updates prior to the first official GDP release. These impacts are calculated in real time and averaged over the evaluation period from 2021 Q1 to 2025 Q4. Panel (d) displays the quarterly nowcast revisions following data releases. Black solid line (right-hand side vertical axis) shows the revisions of GDP growth nowcasts for 2025Q3 estimated based on a two-factor dynamic factor model. Red hollow diamond represents the published actual GDP growth. Black triangle marks (left-hand side vertical axis) depict the changes in two consecutive quarterly nowcasts of GDP growth. Coloured bars show the contribution of each predictor to the nowcast updates. PMI = Stanbic Bank Kenya PMI; REM = Diaspora Remittances; ARR = Visitor Arrivals; ELEC = Electricity Production; VEH = Vehicle Production; M2 = Money Supply; EXP = Exports of Goods; IMP = Imports of Goods; COF = Exports of Coffee; TEA = Exports of Tea; MCASH = Mobile Money; GDP = Real GDP.
Policy implications of nowcasting
The main takeaway is straightforward: nowcasting is feasible and useful in LICs. Even with few indicators – and in economies exposed to external shocks, domestic disruptions, climate events, institutional fragility, and thin policy buffers – simple and transparent models can still provide timely signals of current economic conditions, helping policymakers react faster and more effectively when shocks hit.
For Kenya, incorporating non-traditional data such as digital payments enhances the monitoring of private consumption and complements standard economic indicators. More broadly, the framework can be extended to other low-income countries, including those where GDP is still published only annually, provided that a handful of timely monthly and/or quarterly indicators are available.
As data ecosystems continue to evolve, especially with the expansion of digital financial services, nowcasting offers a practical way to turn high-frequency information into actionable macroeconomic insights – well before official GDP figures are released.
Authors’ note: The views expressed in this blog are those of the authors and do not necessarily represent the views of the IMF, its Executive Board, or IMF management.
References
Banbura, M, D Giannone, M Modugno, and L Reichlin (2013), “Now-casting and the real-time data flow,” in G Elliott and A Timmermann (eds), Handbook of Economic Forecasting, 2: 195–237.
Banbura, M, and M Modugno (2014), “Maximum likelihood estimation of factor models on datasets with arbitrary pattern of missing data,” Journal of Applied Econometrics, 29(1): 133–160.
Cascaldi-Garcia, D, M Luciani, and M Modugno (2024), “Lessons from nowcasting GDP across the world,” Handbook of Research Methods and Applications in Macroeconomic Forecasting: 187–217.
Danov, N, D Giannone, A Kabundi, C Okou, and A Spilimbergo (2026), “Nowcasting GDP growth for Kenya,” Unpublished manuscript.
Doz, C, D Giannone, and L Reichlin (2012), “A quasi-maximum likelihood approach for large, approximate dynamic factor models,” Review of Economics and Statistics, 94(4): 1014–1024.
Giannone, D, L Reichlin, and D Small (2008), “Nowcasting: The real-time informational content of macroeconomic data,” Journal of Monetary Economics, 55(4): 665–676.
Kose, M A, C Otrok, and C H Whiteman (2003), “International business cycles: World, region, and country-specific factors,” American Economic Review, 93(4): 1216–1239.
Stock, J H, and M W Watson (2016), “Dynamic factor models, factor-augmented vector autoregressions, and structural vector autoregressions in macroeconomics,” in J B Taylor and H Uhlig (eds), Handbook of Macroeconomics, 2: 415–525.