Contrary to survey estimates, analysis of ‘distributional national accounts’ data shows that the Middle East is the most unequal region in the world
In recent decades, the Middle East has been the scene of dramatic political events: wars, invasions, revolutions, and various attempts to redraw the regional political map. Given this context, several studies question the link between this political turmoil and the structure and level of socioeconomic inequality in the region.
However, survey-based estimates suggest that inequality in Middle Eastern countries is not particularly high by historical and international standards, and that the source of dissatisfaction might lie elsewhere (Bibi and Nabli 2010). This somewhat surprising fact has been described as the ‘Arab inequality puzzle’ (World Bank 2015).
In a new study (Alvaredo et al. 2017), we attempt to explain this puzzle in two ways. First, we change the level of analysis and study inequality in the Middle East as a whole, as perceptions about inequality may be determined not only by within-country inequality. This choice is motivated by three concerns:
- The scarcity of survey data at the national level, which limits an in-depth analysis at the country level.
- The relatively large degree of cultural, linguistic and religious homogeneity, at least compared with other regions in the world.
- The need to go beyond the concept of the nation-state to understand inequality patterns and dynamics.
Second, we argue that until recently, available data were insufficient to measure inequality properly. Survey data, which notoriously suffer from top coding, underreporting, and truncations problems, must be complemented by other data sources, such as fiscal data, to produce reliable inequality statistics.
We therefore apply the new methodology developed in Alvaredo et al. (2016) and create ‘distributional national accounts’ for the Middle East – that is, inequality distributional micro-files that match macro aggregates, as measured by national accounts. To do so, we combine household surveys, national accounts, income tax data, and rich lists in a systematic manner to produce the first estimates of income inequality at the regional level.
More precisely, we use the first fiscal data available in the region (from Lebanon, analysed in Assouad 2017), survey micro-data, and new generalised Pareto interpolation techniques (Blanchet et al. 2017), which enable us to analyse income tabulations with limited information. We follow the ‘distributional national accounts’ guidelines to produce estimates consistent with national accounts figures.
We find that the Middle East appears to be the most unequal region in the world.
Extreme inequality between and within countries
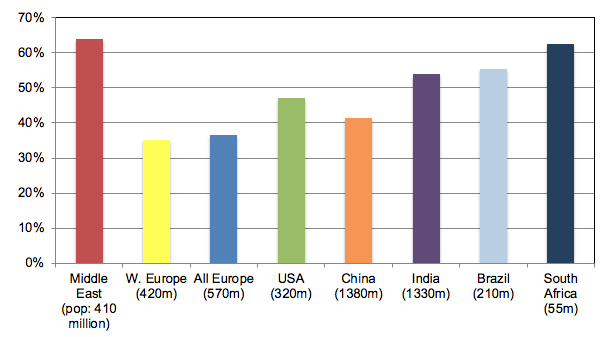
According to our benchmark estimates, the share of total income accruing to the top 10% of income earners is about 64% in the Middle East, which compares with 37% in Western Europe, 47% in the US, 55% in Brazil, and 62% in South Africa – the two latter countries being often characterised as the most unequal in the world (see Figure 1).
Figure 1 Top 10% income share, Middle East versus other countries

Notes: Distribution of national income (before taxes and transfers, except pensions and unemployment insurance) among adults. Corrected estimates combining survey, fiscal, wealth, and national accounts data. Equal-split series (income of married couples divided by two). Latest years available (2012–2016).
Source: Alvaredo et al. (2017)
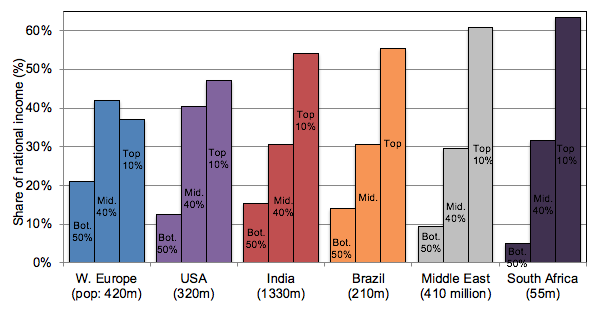
Furthermore, and as in other extremely unequal regions, the Middle East is characterised by a dual social structure. There is an extremely rich group at the top, whose income levels are broadly comparable to their counterparts in high-income countries, and a much poorer mass of the population left with little income (see Figure 2). This structure reflects the absence of a broad ‘middle class’, as the middle 40% of the income distribution is left with far less income than the top 10% in the middle (while it receives much more in Western Europe, and only a bit less in the US).
Figure 2 Bottom 50% versus middle 40% versus top 10%, across the world

Source: Assouad et al. (2018)
The origins of extreme inequality in these different groups of countries are different. In the Middle East, it is largely due to the geography of oil ownership and the transformation of oil revenues into permanent financial endowments. This translates into a major gap in average income between Gulf countries and other countries, which drives our results. As an example, in 2016, Gulf countries gathered 15% of the total regional population but received almost half of the total income.In contrast, extreme inequality in South Africa is related to the legacy of the apartheid system – until the early 1990s, only the white minority (about 10% of the population, which until today roughly corresponds to the top 10% income group) had full mobility and ownership rights. In Brazil, the legacy of racial inequality also plays an important role – it was the last major country to abolish slavery in 1887, at a time when slaves made up about 30% of the population.
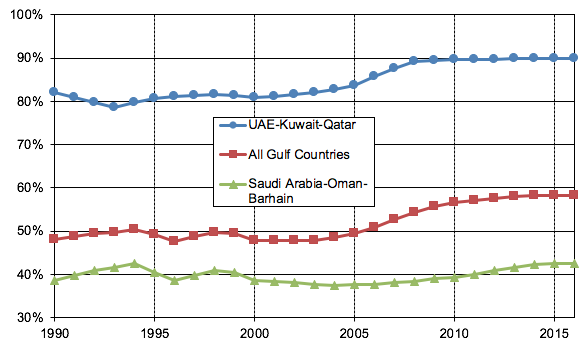
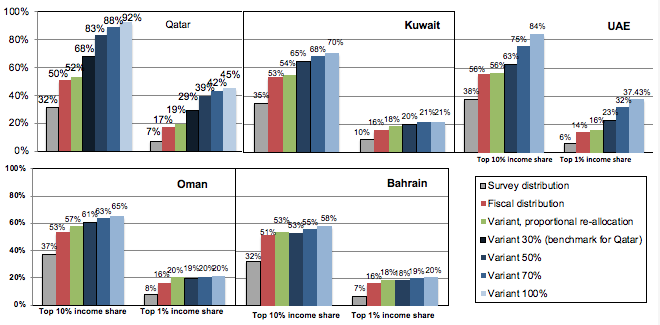
Our results are also driven by large within-country inequality. However, our ability to measure it properly is still limited, given the low quality of available sources and the lack of fiscal data. The problem is particularly acute in the Gulf countries, where survey data do not accurately capture the growing share of the migrant population, a large majority of which is composed of low-paid workers living in difficult conditions and receiving much less income than nationals (see Figure 3). Survey data in the Gulf countries only cover 20–30% of total national income. To the extent that nationals benefit from the excluded income components (which typically refer to the undistributed profits of oil corporations and the accumulated capital income of sovereign wealth funds) more than foreigners, we also present alternative specifications, which attribute 50%, 70% or 100% of missing income to the nationals and the rest – if any – proportionally to the entire population. This leads to top decile varying between 65% and 85% in each country, and even 90% in the case of Qatar, the country with the larger share of foreign workers and whose survey data miss a substantial amount of income (see Figure 4). At the regional level, the top decile is closer to 70% of total income.
Figure 3 Shares of foreigners in Gulf countries, 1990–2016

Notes: Shares of foreigners in the adult population (20+) of Gulf countries (as measured by censuses, administrative sources, and household surveys).
Source: Alvaredo et al. (2017).
Figure 4 Inequality statistics in Gulf countries, 2016 (variants)

Notes: Distribution of income (before taxes and transfers, except pensions and unemployment insurance) among equal-split adults (income of households divided equally among adult members). Survey income series solely use self-reported survey data (but anchors distributions to per adult national income). Fiscal income estimates combine survey and income tax data (but do not use wealth data to allocate tax-exempt capital income). Final estimates (with variants) combine survey, fiscal, wealth, and national accounts data. Variants estimates are the result of imputing a fraction of missing income (the gap between national income and total survey income) so that the average income in the survey (augmented by the imputation) represents 30, 50, 70, or 100% of the average national income, and combine survey, fiscal, wealth, and national accounts data. We also consider a conservative variant where the missing income is proportionally attributed to both foreigners and nationals.
Source: Alvaredo et al. (2017).
Perspectives
The extreme concentration of income at the regional level highlights the need to increase pro-poor investments in health, education, and infrastructure, and to develop mechanisms of regional redistribution. Such mechanisms already exist, but they should be implemented more systematically.
In addition, the tax systems of most countries in the region rely overwhelmingly on regressive indirect taxes, with only a few components comprising direct progressive taxes. In particular, it is striking to observe the near absence of a progressive inheritance tax regime in most countries of the region. Yet this is a historically powerful tool for limiting the persistence of extreme income inequality levels, and to finance welfare services.
Finally, while we believe that our estimates are more robust than survey-based official inequality statistics, we stress that access to more and better data is critical in the Middle East, where a lack of transparency raises the problem of democratic accountability, independent of the actual level of inequality observed.
Editors' note: This column first appeared on VoxEU.org on 13 August 2018.
References
Alvaredo, F, L Assouad and T Piketty (2017), “Measuring inequality in the Middle East, 1990-2016: The world’s most unequal region?” WID.world Working Paper no 2017/15.
Alvaredo, F, A B Atkinson, L Chancel, T Piketty, E Saez and G Zucman (2016), “Distributional National Accounts (DINA) guidelines: Concepts and methods used in the World Wealth and Income Database,” WID.world Working Paper no 2016/1.
Assouad, L (2017), “Rethinking the Lebanese Economic Miracle: The extreme concentration of income and wealth in Lebanon, 2005-2014,” WID.world WorkingPaper no 2016/13.
Assouad, L, L Chancel and M Morgan (2018), “Extreme inequality: Evidence from Brazil, India, the Middle East and South Africa,” American Economic Association Papers & Proceedings.
Bibi, S, and M K Nabli (2010), “Equity and inequality in the Arab Region,” ERF Policy Research Report no 33.
Blanchet, T, J Fournier and T Piketty (2017), “Generalized Pareto curves: Theory and applications to income and wealth tax data for France and the United States, 1800-2014,” WID.world WorkingPaper no 2017/3.
World Bank (2015), “Inequality, uprisings, and conflict in the Arab World,” World Bank and Middle East and North Africa Region, MENA Economic Monitor.


