


When official statistics are unavailable or unreliable, researchers can use a range of forensic methods – such as satellite imagery, mirror trade data, price monitoring, refugee surveys, humanitarian data, and text mining – to extract credible economic information, with North Korea illustrating both the possibilities and limits of studying economic ‘black holes’.
Editor's note: The authors have made slides available here. For a broader synthesis of themes covered in this article, check out our VoxDevLit on Informality.
Economists often attempt to study places for which data is scarce or non-existent, up to and including entire countries. The reasons vary: some governments lack the state capacity to collect reliable statistics, which is a problem correlated with income levels and sometimes compounded by terrain. Civil wars and insurgencies can turn regions into informational voids. And authoritarian regimes may deliberately control data for political reasons, inflating growth rates (Martinez 2022) or suppressing unfavourable indicators like unemployment or caloric intake. Hollyer et al. (2011) find that democracies are more transparent than autocracies, even after controlling for income and country-fixed effects.
We call these data-scarce places ‘economic black holes’. In recent work (Haggard, Kim, and Lee 2026), we use North Korea as an entry point to review the forensic methods that researchers have developed to extract usable economic information from such settings.
Studying economic black holes: North Korea
Although North Korea is a low-income country, it does not face the same domestic political instability as many other poor countries. Rather, data remains scarce because of the unusually repressive nature of the regime. The government treats even basic economic data as a state secret. The country publishes a national budget, and in 2021 it submitted a Voluntary National Review to the UN reporting a variety of development indicators. But these data points raise more questions than they answer. North Korea sits outside the system of international organisations that enforce statistical standards. As a result, there is no transparency about how government data is collected.
Still, researchers have found creative ways to gather useful information. Drawing on the idea of ‘forensic economics’ (Zitzewitz 2012), we survey six methods and assess their strengths and weaknesses.
Six forensic methods
Satellite imagery. Nighttime lights have become a widely used proxy for economic activity in development research (Henderson et al. 2012, Donaldson and Storeygard 2016). In North Korea, Kim (2022) used satellite data to build alternative GDP estimates that diverge sharply from the Bank of Korea’s official figures. After 2000, night lights suggest growth that the official estimates miss, likely because of the expansion of the informal sector. Satellites can also pick up agricultural productivity, air pollution, and land-use changes.
Humanitarian agency data. Crises can open windows for outside data collection. North Korea’s catastrophic famine in the mid-to-late 1990s allowed the international community to insist on gathering pertinent data, for example, on crop production (Haggard and Noland 2007). Between 1998 and 2017, the World Food Programme and UNICEF conducted seven surveys on child nutrition, documenting real improvement. But this access is fragile, as international organisations have been shut out since COVID-19 border closures in 2020.
Mirror trade statistics. North Korea treats all trade data as a state secret, but its trading partners do not. By assembling ‘mirror statistics’ from partners’ customs records, researchers can reconstruct trade flows. This approach reveals the effects of UN sanctions and COVID-19 border closures on North Korean trade, and has been used to study export quality, sanctions compliance, and smuggling (e.g. Kim et al. 2023).
Price data. After the collapse of the rationing system during the famine, markets became central to North Korean life. Despite real personal risk, networks of local surveyors transmit price data via cell phones connected to Chinese networks, allowing outside researchers to construct price indices for basic commodities and exchange rates.
For example, Figure 1 shows market prices for coal (an export-sanctioned commodity) and refrigerators (an import-sanctioned item) before and after the sanctions. Refrigerator prices rose sharply from the third quarter of 2016, in anticipation of the full implementation. Coal prices fell as Chinese buyers pushed for discounts on what had become illicit trade. Goods not subject to sanctions stayed stable. These patterns confirm that the trade restrictions had real bite and affected conditions in North Korea’s domestic markets.
Figure 1: Market prices of coal and refrigerators in North Korea
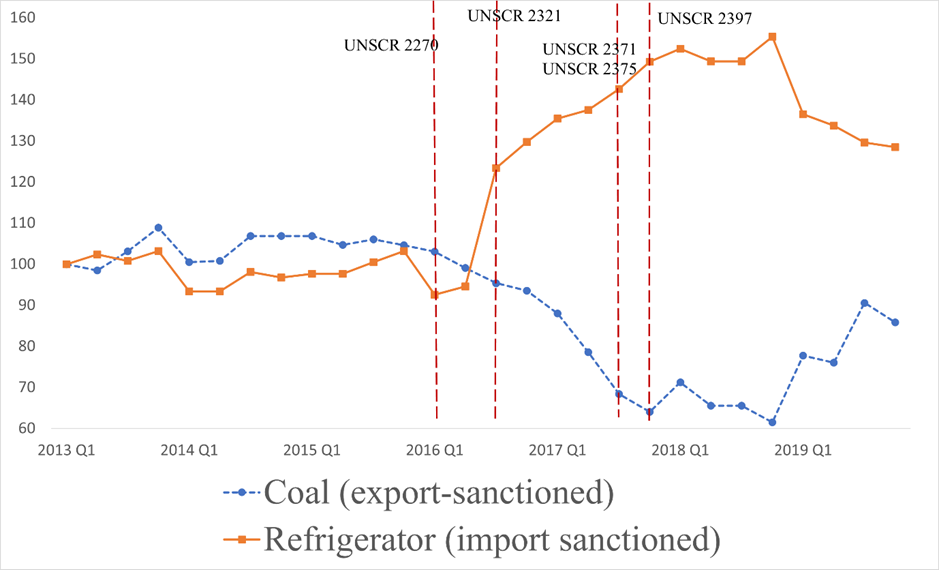
Notes: Quarterly average market prices, 2013 Q1 = 100. Source: Haggard, Kim, and Lee (2026), using NK Investment Development data.
Refugee surveys. Ulyssea et al. (2025) document that informal sectors account for 30–70% of GDP across developing countries, but measuring that activity is a challenge everywhere. North Korea is an extreme case. Researchers must rely on defector testimony because the regime actively suppresses data on market activity. Structured surveys of North Korean defectors have put the informal market’s share of household income at roughly 70% (Kim 2017). Researchers have also run behavioural experiments with defectors, examining how life under authoritarianism shapes economic preferences around markets and redistribution (Choi et al. 2020).
Official documents. Authoritarian regimes do not just suppress information. They also use state media to communicate policy priorities. Text mining of North Korea’s official newspaper, the Rodong Sinmun, has yielded quantitative data on the names, locations, and classifications of over 3,000 firms (KIET North Korean Industry and Company DB) and can be used to study government policy priorities.
Strengths and weaknesses of forensic methods
No single method is enough on its own. The most robust findings come from triangulating across sources. Table 1 summarises the key trade-offs.
Table 1: Summary of six forensic methods
| Method | Applications | Strengths | Weaknesses |
| Satellite imagery | Estimating economic activity from night lights | Objective, large-scale, real-time data | Requires technical expertise; may underestimate agriculture |
| Humanitarian agencies | Child nutrition, crop and food security surveys | Directly measured, standardised methodology | Infrequent, restricted access, reporting bias |
| Mirror trade statistics | Tracking cross-border trade flows | Captures disruptions and recovery patterns | Misses informal trade and smuggling |
| Price data | Tracking cost of living and market conditions | Reflects real economic conditions on the ground | Measurement error; safety risks for surveyors |
| Refugee surveys | Informal economy, preferences, household income | Rich behavioural and attitudinal data | Sampling bias, reliability concerns |
| Official documents | Economic policies, industrial structure via text mining | Unique policy information; convertible to quantitative data | Government-controlled content; vulnerable to falsification |
Source: Haggard, Kim, and Lee (2026).
The future of economic black holes
We have used North Korea as an example, but our methods are germane to any jurisdiction where data is scarce, from other authoritarian regimes to conflict zones to remote regions where the reach of the state is limited. Advances in artificial intelligence are making it easier to pull structured data out of unstructured sources. For example, high-frequency mobility data from cell phone signals in economic black holes, already used to study COVID-19 responses (Argente et al. 2022) and African urbanisation (Blanchard et al. 2025), could be used to study cross-border networks and even mobility.
It is also worth remembering that economic black holes do not necessarily stay closed. Data breaches can be data goldmines if researchers have their eyes open for them. And if North Korea were to open up or the North Korean regime were ever to fall, government documents and data would create extraordinary research opportunities, as much as the Soviet collapse enabled economic historians to revisit Soviet-era policies with fresh evidence. The two Koreas implemented different land reforms in the 1950s (Kim and Lee 2025) and pursued different industrial policies in the 1960s and 1970s (Kim, Lee, and Shin 2021). How much did these choices contribute to South Korea’s take-off and North Korea’s stagnation? We may yet find out.
Studying economies with little data will always be challenging work. But the toolbox keeps expanding, and the lessons from North Korea suggest that ‘black holes’ need not stay entirely dark.
References
Argente, D, C-T Hsieh, and M Lee (2022), “The cost of privacy: Welfare effects of the disclosure of COVID-19 cases,” Review of Economics and Statistics, 104(1): 176–186.
Blanchard, P, D Gollin, M Kirchberger, and M Peters (2025), “High-frequency human mobility in three African countries,” Unpublished manuscript.
Choi, S, B-Y Kim, J Lee, and S Lee (2020), “A tale of two Koreas: Property rights and fairness,” Journal of Economic Behavior & Organization, 170: 112–130.
Donaldson, D and A Storeygard (2016), "The View from Above: Applications of Satellite Data in Economics", Journal of Economic Perspectives, 30(4): 171-98.
Haggard, S, K Kim, and M Lee (2026), “Studying economic black holes: Lessons from North Korea,” World Development, 201: 107315.
Haggard, S, and M Noland (2007), Famine in North Korea: Markets, aid and reform, Columbia University Press.
Henderson, J V, A Storeygard, and D N Weil (2012), “Measuring economic growth from outer space,” American Economic Review, 102(2): 994–1028.
Hollyer, J R, B P Rosendorff, and J R Vreeland (2011), “Democracy and transparency,” Journal of Politics, 73(4): 1191–1205.
Kim, B-Y (2017), Unveiling the North Korean economy: Collapse and transition, Cambridge University Press.
Kim, J, K Kim, S Park, and C Sun (2023), “The economic costs of trade sanctions: Evidence from North Korea,” Journal of International Economics, 145: 103813.
Kim, K (2022), “The North Korean economy seen by satellite: Estimates of national performance and regional gaps based on nighttime light,” Journal of Asian Economics, 78: 101405.
Kim, M, and M Lee (2025), “From tenancy to ownership: Land reform, productivity, and human capital,” Unpublished manuscript.
Kim, M, M Lee, and Y Shin (2021), “The plant-level view of an industrial policy: The Korean heavy industry drive of 1973,” Unpublished manuscript.
Martinez, L R (2022), “How much should we trust the dictator’s GDP growth estimates?,” Journal of Political Economy, 130(10): 2731–2769.
Ulyssea, G, M Bobba, L Gadenne, and M Harari (2025), “Informality,” VoxDevLit, 6(2).
Zitzewitz, E (2012), “Forensic economics,” Journal of Economic Literature, 50(3): 731–769.