


Mobile money taxes raise transaction costs and reduce usage, creating sizable efficiency losses – the burden falls disproportionately on unbanked and rural users.
Editor’s note: For a broader synthesis of themes covered in this article, check out our VoxDevLits on Mobile Money and Taxation.
Mobile money taxes are spreading – fast
Mobile money has transformed payments and broadened financial access across developing countries, especially in Africa where access to banking is relatively limited (Suri et al. 2023). By enabling transfers without a bank account, it allows users to transact simply using basic phones (Suri 2023, Brunnermeier et al. 2023). At the same time, mobile money transactions are relatively easy to observe – making them an attractive tax base.
After Kenya’s 2013 adoption of a mobile money tax, at least 17 sub-Saharan African countries have since introduced similar levies, including Mali and Senegal in 2025. Proponents emphasise revenue potential and ease of collection, while critics worry about efficiency losses and regressivity where formal banking is limited (Hearson et al. 2024). We (Barczay, Hebous, Sawadogo, and Wen 2025) develop a theoretical framework to guide such empirical analysis and test its implications using cross-country surveys and detailed user-level transaction data from a mobile operator.
How a small tax can have big effects
To articulate the effects of mobile money taxes, we present a model in which people can transfer money using cash, mobile money, or bank accounts, each with its own monetary and non-monetary ‘hassle’ costs. The model delivers a clear set of testable predictions: taxing mobile money reduces its use. However, whether this reduction is more pronounced for banked or unbanked users is theoretically ambiguous: banked individuals respond more elastically, since they have an untaxed substitute (a substitution effect), but unbanked users face a larger average-cost effect that can eliminate some transactions altogether. The tax also encourages substitution to other channels, including cash. In this sense, it is regressive because it raises transaction costs disproportionately for those with fewer alternatives – primarily unbanked and rural users.
The tax revenue comes at the cost of generating an ‘excess burden’ because some transactions are abandoned (a rise in the average cost of transacting in the economy) or diverted into more expensive (that is, less efficient) channels. This excess burden is thus present even if bank transactions are taxed identically to mobile money, because cash remains untaxed and the average cost of transacting rises, reducing overall transactions.
What cross-country data shows
We first test the key predictions using cross-country evidence from the IMF Financial Access Survey and the World Bank Global Findex, exploiting staggered adoption of the tax across African countries.
Two patterns stand out:
- Mobile money taxes are followed by sharp reductions in mobile money activity. In event-study estimates, the number of active mobile money accounts per 1,000 adults is roughly 39% lower in the second year after adoption, and the number of transactions per 1,000 adults also declines (with wide confidence bands, so exact magnitudes should be interpreted with caution).
- The Findex survey data show who adjusts. On average, introducing a mobile money tax reduces the probability an individual reports using mobile money by about 8 percentage points (from a pre-treatment mean around 22%).
We also find suggestive evidence of substitution towards cash, and thus informality: the probability of actively withdrawing cash from a bank account rises by about 5 percentage points after a mobile money tax is introduced.
Taxing mobile money in Cameroon and the Central African Republic
Cross-country evidence is informative, but mobile money transaction-level data enables a stronger research design: constructing the control group by matching comparable users in taxing countries with users in an untreated country, and testing for differing effects. The data covers a balanced six-month window before and after the introduction of the mobile money tax in Cameroon (January 2022) and the Central African Republic (CAR) (April 2024). Mali serves as a contemporaneous untreated comparison group, with users matched using propensity-score methods.
We find that the mobile money tax reduces the monthly average number of transactions made by a user by about 2 in Cameroon and 2.9 in CAR (compared to the counterfactual using Mali data). For reference, the pre-tax average number of transactions in Cameroon and CAR was close to six transactions. We also find a significant reduction in both countries in the monthly value of taxed transactions, for example, in Cameroon from XAF 125,000 to XAF 75,000 per user.
Who cuts back the most? Declines are larger in high-bank-penetration regions than in low-bank-penetration regions, and stronger in urban than rural areas (Figure 1), consistent with the hypothesis that users with better outside options are more able to avoid the tax. Because such users can more readily substitute away, the tax burden shifts towards those with fewer alternatives.
Using household expenditure data for Cameroon, we compute effective tax rates (taxes paid as a share of total expenditures) and find that users in low-bank-penetration areas face higher effective rates than those in high-bank areas (about 0.47% versus 0.22% before behavioural adjustment; 0.37% versus 0.16% after accounting for behavioural responses).
Figure 1: Declines in mobile money activity are larger in urban than rural areas after the tax
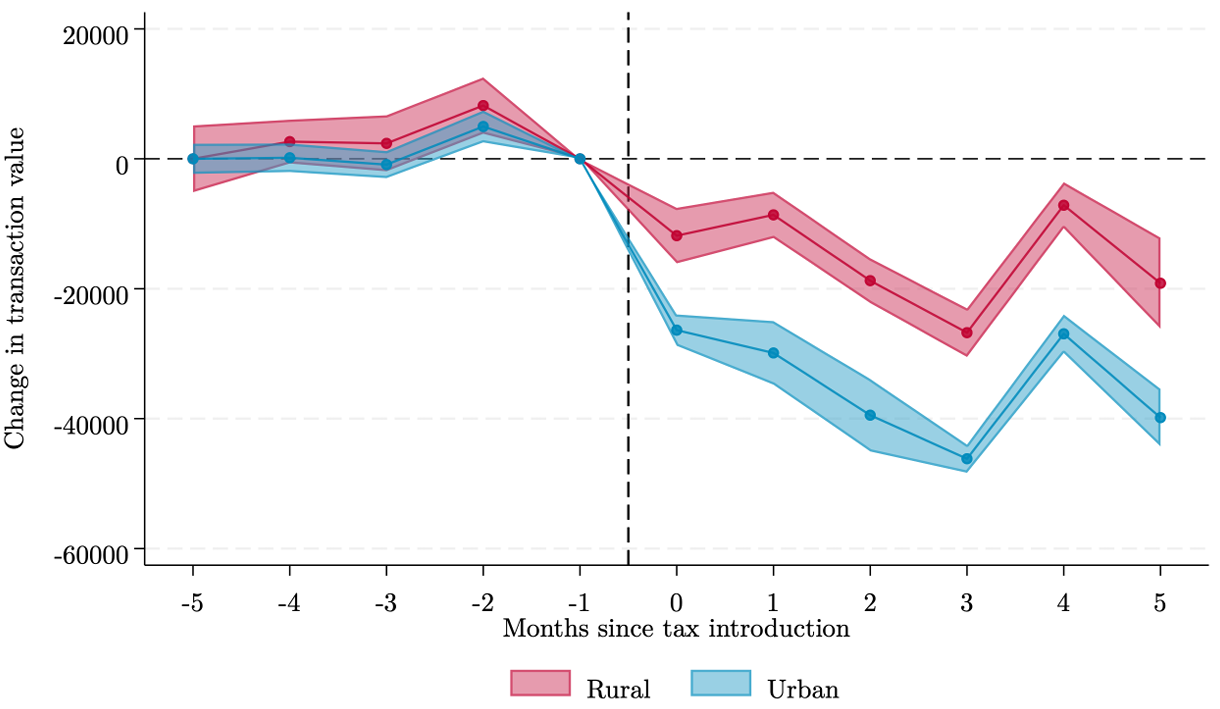
Source: Barczay, Hebous, Sawadogo, and Wen (2025). Notes: The figure shows the estimated effects of introducing the mobile money tax in Cameroon in January 2022 (marked by the vertical dashed line) on users’ monthly transactions in rural and urban regions. Estimates come from an event-time difference-in-differences design comparing taxed transactions in Cameroon with the same transactions in Mali (which did not introduce a mobile money tax during the study period), based on propensity-score matching, and are shown relative to the pre-tax month. Standard errors are bootstrapped. Confidence bands are shown at the 99% level.
The ‘hidden' cost of the tax is significant
Our estimates suggest a short-run price elasticity with respect to the mobile money tax of around -2.1; that is, a 10% increase in the tax-inclusive consumer price is associated with about a 21% decline in the average monthly transaction value per user for taxed transactions.
Overall, for every 100 units of revenue raised, society loses around 35 (as per our estimates of the excess burden loss of the tax). This efficiency cost is the result of behavioural responses manifested in both switching to more expensive alternatives and an overall higher average cost of transacting.
If the goal is to tax telecom rents, there are better tools
Some observers may hope mobile money taxes help capture rents in the telecom sector. But when taxes are passed through to users, the design does not primarily tax rents – it ends up taxing everyday transactions. Our findings reinforce a broader point from the telecom taxation evidence base: if the policy goal is to capture rents, more targeted approaches – such as spectrum auctions, license fees, or rent-based tax designs – are typically less distortive than transaction taxes that fall on users.
Policy implications: Taxing mobile money
Our analysis suggests that mobile money taxes are inefficient, regressive, and encourage shifts back towards cash (informality). Whether a mobile money tax can be tolerated nonetheless on low state-capacity grounds ultimately depends on the social marginal value of public funds. This value needs to exceed the efficiency cost (in our estimates 35% of revenue) and the additional losses from a shift to cash (informality) and a distributional penalty (if inequality carries any social cost). While the latter two costs lie outside the primitives of our model and data, they are likely strictly positive. Existing estimates for African countries place the marginal cost of public funds around 1.1–1.2 (Auriol and Warlters 2012), which is already below the necessary condition for desirability of the mobile money tax that requires the social marginal value of public funds to be well above 1.35 even on efficiency grounds.
Authors’ note: The views expressed here are those of the authors and do not necessarily represent the views of the IMF, its Executive Board, or IMF management.
References
Auriol, E, and M Warlters (2012), “The marginal cost of public funds and tax reform in Africa,” Journal of Development Economics, 97(1): 58–72.
Barczay, M, S Hebous, F Sawadogo, and J-F Wen (2025), “Taxing mobile money: Theory and evidence,” Unpublished manuscript.
Brunnermeier, M, N Limodio, and L Spadavecchia (2023), “Mobile money, interoperability, and financial inclusion,” Unpublished manuscript.
Hearson, M, P Mader, M Abounabhan, M Carreras, A Diouf, A Lees, et al. (2024), “Taxing mobile money in Africa: Risk and reward,” Unpublished manuscript.
Jensen, A, A Brockmeyer, and L Gadenne (2024), “Taxation and development,” VoxDevLit, 12(1).
Suri, T, J Aker, C Batista, M Callen, T Ghani, W Jack, L Klapper, E Riley, S Schaner, and S Sukhtankar (2023), “Mobile money,” VoxDevLit, 2(2).