


The World Bank’s Digital Connectivity Tracker reveals that while mobile phone and internet access are expanding rapidly across developing economies, significant inequalities persist – especially for women, low-income, and rural populations – making smartphone ownership a key determinant of digital inclusion.
Mobile technologies and services contributed US$6.5 trillion to global annual GDP in 2024, according to GSMA (2025a). These technologies are having a significant, positive economic impact on adults living in developing economies by offering opportunities for them to grow their businesses, find a job, access education, and use financial services. Yet until recently, there has been no reliable, globally comparable, and gender-disaggregated source of data on mobile phone ownership, internet use, digital activities, or everyday digital risks.
The Global Findex Digital Connectivity Tracker was created to fill that gap. With survey responses from 75 developing economies, representing over 77,000 adults, the Digital Connectivity Tracker adds exciting new indicators to the World Bank’s triennial Global Findex survey of financial inclusion indicators.
In this article, we highlight the key findings from this new dataset, unpack the motivation and methods behind the Digital Connectivity Tracker, and situate the dataset in context with other available data sources to better understand key methodological differences within the ecosystem of data on digital behaviours.
The Global Findex Digital Connectivity Tracker finds impressive mobile phone ownership rates, yet continued inequality
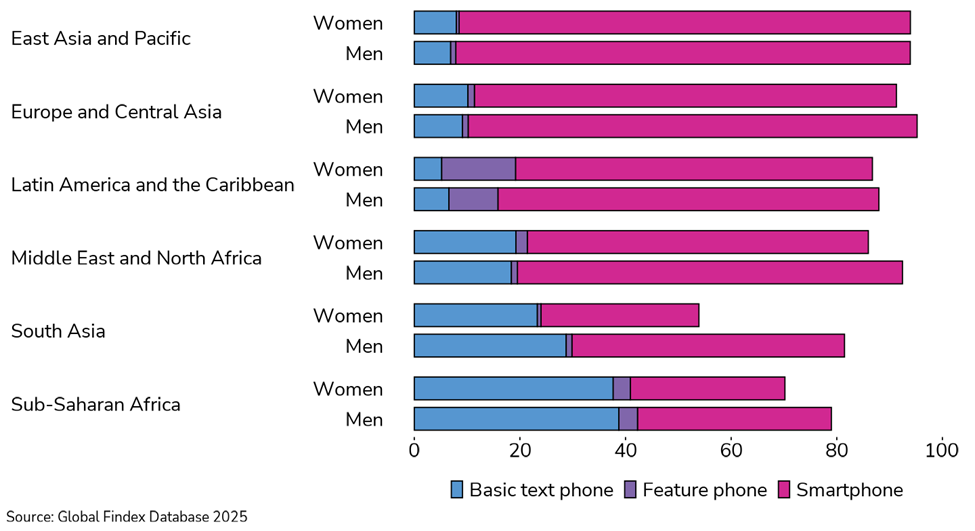
Headline findings from the Global Findex Digital Connectivity Tracker show that 84% of adults in developing economies own a mobile phone. Smartphones capable of running apps and internet browsers represent the vast majority of mobile phones in every developing region except for sub-Saharan Africa, where more than half of mobile phone owners have only a basic or feature phone with no internet access, and South Asia, where only one-third do (Figure 1).
Figure 1: Phone ownership is widespread around the world, though women are less likely than men to own one
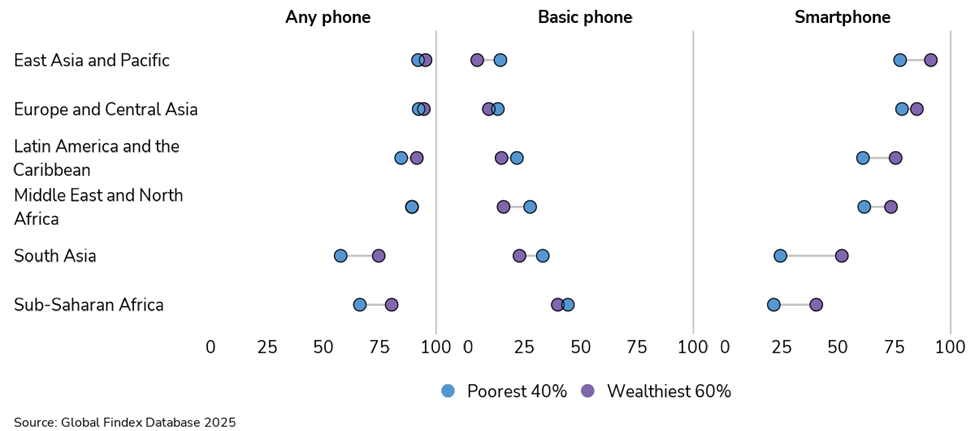
The data offer much needed nuance to discussion of gaps in access to phones. Low-income adults and women in developing economies are 8 and 9 percentage points less likely, respectively, to own a personal phone than higher-income adults and men (Figure 2). These gaps are concentrated in smartphone ownership rather than basic phones. Income-related gaps are widespread, present in nearly every country. Gender gaps, by contrast, are driven by large disparities in a handful of populous economies, most notably Pakistan, which has the world’s largest gender gap at 65 percentage points. A closer look at the data shows that 55 of the 75 developing economies in the Digital Connectivity Tracker report no gender gap in overall mobile phone ownership, and basic phone ownership gaps are statistically insignificant in every region except South Asia.
Figure 2: Differences in mobile phone ownership, by household income and type of phone
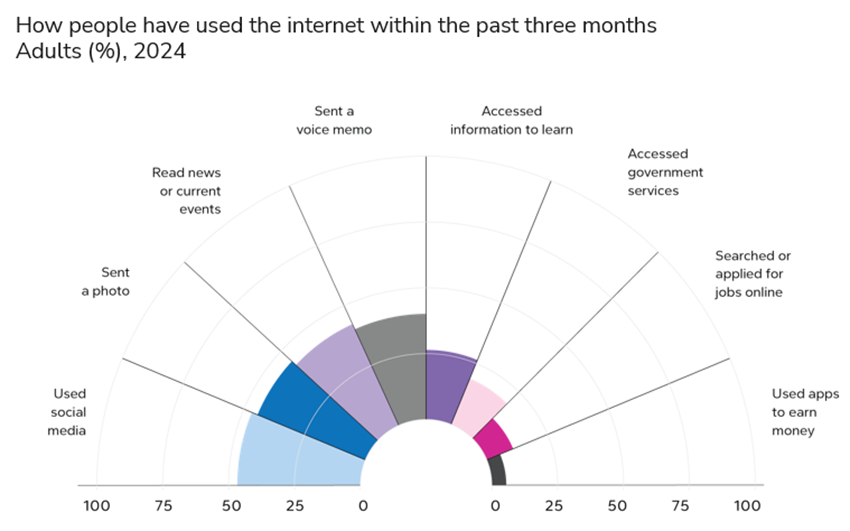
Our data shows smartphones are overwhelmingly the key channel for internet access in developing economies. Of the 67% of adults in developing economies who used the internet in the three months before taking the survey, 90% of them get online using their smartphones. The internet usage gaps by gender, income, and rural residency are the same as the smartphone gaps for these groups, making smartphone ownership a de facto prerequisite for accessing social media, internet-based information, online learning and educational resources, government websites and online services, online job postings, and digital money-making opportunities (Figure 3). Though digital payments services in the form of mobile money have achieved widespread adoption on even basic phones in many countries in sub-Saharan Africa, smartphones remain essential for accessing the broader suite of digital financial services offered by banks or through apps.
Figure 3: Variation in the penetration of digital behaviours and internet use cases
Though digital connectivity through mobile phone ownership and internet use offers huge potential benefits, it also exposes users to risks such as scams and digital harassment. The share of adults reporting these experiences rises proportionally with overall phone ownership. As such, women are not more likely than men to report scams or harassment, rather, these experiences generally track levels of online activity.
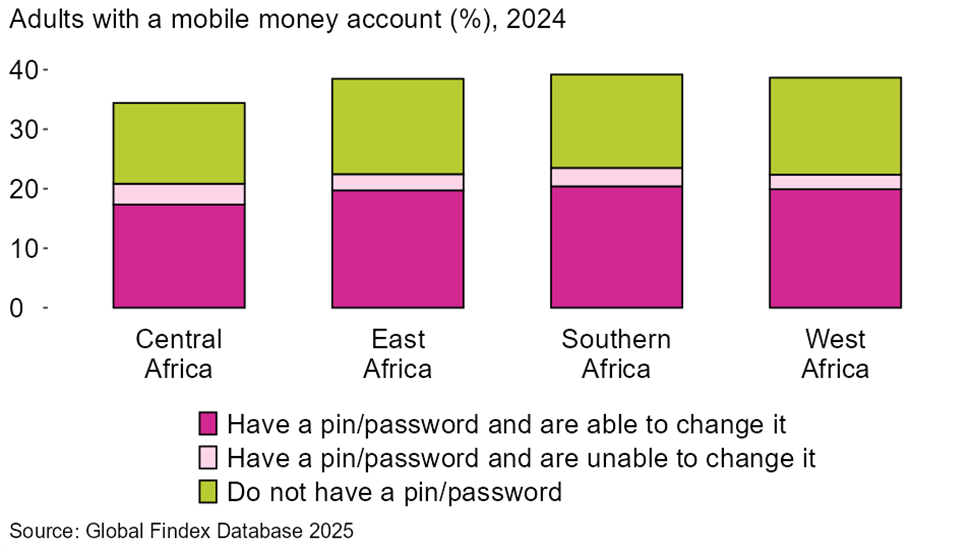
Furthermore, device passwords – a first line of defence against theft – are used by only 60% of mobile phone owners worldwide. Women are ten percentage points less likely than men to password-protect their phones, likely because they are more likely to own hand-me-down phones or a new phone that was purchased and set up by someone else for their use. In sub-Saharan Africa, only 48% of phones are password- protected, reflecting the widespread use of basic phones that lack biometric identification. Furthermore, only half of mobile money account owners in the region have a password on their phone (Figure 4). Although mobile money accounts typically require PIN numbers, unsecured phones still leave users vulnerable to theft.
Figure 4: Half of adults with a mobile money account in sub-Saharan Africa lack a password on their phone
Across regions, the most frequently cited barrier to both basic and smartphone ownership is the cost of the device, followed by the expense of purchasing airtime and data. Another significant barrier to smartphone ownership is basic literacy, particularly among women.
This is just a snapshot of the main findings from the Global Findex 2025 Digital Connectivity Tracker. Overall, it shows a promising spread of mobile phones and internet use, while also highlighting that access is not yet universal, especially among low-income populations, rural residents, and women. Understanding who lacks access, where they are, and the barriers they face can help policymakers and other stakeholders focus attention on them and spur innovation to overcome constraints in places where market forces alone may not drive equitable solutions.
How the Global Findex Digital Connectivity Tracker complements other data sources
As demonstrated in these snapshot findings, the Digital Connectivity Tracker provides disaggregated demand-side data to support progress in driving digital connectivity and complements other data sources, including those collected by the International Telecommunications Union (ITU) and national statistical agencies, as well as by the data teams at the GSMA and organisations like Research ICT Africa.
The Global Findex Digital Connectivity Tracker and ITU data
Data from the ITU supports measurement towards the Sustainable Development Goal (SDG) 17.8 on “the proportion of individuals using the internet”. ITU data may be, according to ITU documentation and analysis, imputed and/or modelled for developing economies, particularly those in Africa. This limitation is not due to any lack of technical rigour from the ITU team. Instead, it is often due to limitations with the underlying data reported by countries, not all of which have national statistical offices or run high-quality demand-side surveys.
In this context, the Digital Connectivity Tracker offers an independent complement to the ITU’s measures, one that is globally harmonised and comparable across economies. The Global Findex Digital Connectivity Tracker survey questions about internet use furthermore precisely mirror the ITU definition to ensure relevance to ITU’s reporting mandates.[1]
How the Digital Connectivity Tracker compares with national demand-side data sources
Beyond the ITU data, some developing economies also invest in rich demand-side data on connectivity topics. Government agencies, often led by or in collaboration with the national statistical organisations, have run dedicated household and individual ICT surveys in countries like Bangladesh, the Philippines, and Thailand (A4AI and A2I 2020, DICT 2022, NSO 2024). These government surveys are often representative at the national and sub-national level, due to sample sizes that are large enough to allow for nuanced analysis by population sub-segment. However, accessing the microdata for these datasets can sometimes be challenging for independent researchers.
In comparison to these national datasets, the scope of the Global Findex Digital Connectivity Tracker is narrower and limited to a short, three-minute survey module. The sample size of 1,000 observations per country is not representative below the national level and should not be used to analyse narrow population sub-segments (e.g. young urban women, self-employed rural adults). Yet the Digital Connectivity Tracker may be more accessible and usable. As an open and available module of the Global Findex Database, the Digital Connectivity Tracker allows for one-click downloads of national indicators and enables similarly easy download of individual microdata.
Comparing the Digital Connectivity Tracker to complementary demand-side data sources
Other sophisticated and nationally representative sources of consumer data also exist for selected economies from organisations like GSM Association (GSMA) and Research ICT Africa (RIA). As these sources have been around longer, they provide longitudinal data over time, though for a smaller number of countries.[2] As an example, the 7th annual edition of the GSMA’s “Mobile Gender Gap Report” included 15 developing economies in 2024 (GSMA 2025b). Research ICT Africa has conducted five rounds of internet and connectivity surveys since 2004, each of which has included between seven and 17 countries in Africa. Sample sizes for both of these sources are similar to those of the Global Findex Digital Connectivity Tracker and researchers for the GSMA and Research ICT Africa surveys provided invaluable expert advice during the development of the Global Findex questionnaire.
There is remarkable alignment across the Global Findex Digital Connectivity Tracker, the GSMA, and Research ICT Africa surveys on many connectivity indicators, such as overall phone ownership and gender equity. However, the surveys differ on their findings for other indicators, most notably smartphone ownership. This likely highlights methodological differences in the respective questionnaires. For example, the GSMA asks respondents if they are the ‘main user’ of a smartphone, whereas the Global Findex asks if the respondent ‘owns’ the smartphone. Such word choices can lead to data discrepancies, especially if women use someone else’s phone or one earmarked for household use. This may explain why Findex finds significantly lower reported smartphone ownership in Pakistan – women might have main use of a smartphone, but might not (or might not perceive themselves) as having ‘ownership’ over an expensive household asset.
Data differences also arise based on differences in survey methods, such as face-to-face versus phone-based versus web-based instruments. Though the latter is more affordable, quick to implement and capable of capturing a larger sample, it creates sample bias in favour of adults already using the internet, which will limit the usefulness of the data for identifying gaps for underserved adults, including women and those with low incomes.
Using the Global Findex Digital Connectivity Tracker
This discussion highlights several of the main methodological considerations users should keep in mind when using the Digital Connectivity Tracker to measure progress in digital inclusion and inform policies and programmes aimed at helping low-income adults take advantage of opportunities in the digital economy. Download the microdata and please share your experiences and use cases as we work to improve this open resource.
References
Alliance for Affordable Internet (A4AI) and Access to Information Programme (A2I) (2020), "Bangladesh national ICT household survey: Report and overview of main results 2018–2019".
Department of Information and Communication Technology (DICT) (2022), "ICT Indicators".
GSMA (2025a), "The mobile economy 2025".
GSMA (2025b), "The mobile gender gap report 2025".
Klapper, L, D Singer, L Starita, and A Norris (2025), "The global findex database 2025: Connectivity and financial inclusion in the digital economy", World Bank.
National Statistical Office Thailand (NSO) (2024), "Statistical yearbook Thailand 2024".
World Bank (2025), "The global findex database 2025: Download data".