

Brazil’s R&D subsidy programme spurred long-term growth by helping financially constrained companies adopt foreign technologies and expand into high-tariff markets through import substitution.
Over the past 20 years, Brazil has operated a large-scale R&D subsidy programme, providing over US$10 billion to 1,454 firms. One of the recipients of this programme was Eurofarma, a pharmaceutical company that used the subsidy to launch a biotechnology laboratory (Finep 2015). Rather than develop a novel drug, Eurofarma used the subsidy to create its own version of filgrastim, a widely studied compound previously imported from the US and Europe.[1]
Although the drug was already known, it was the first time that a company in Latin America replicated its production process (Gabi 2016). Despite not being a breakthrough innovation, the product allowed Eurofarma to grow rapidly, capturing the Brazilian and South American markets from foreign competitors, in part due to Eurofarma’s competitive edge: as a domestic producer, Eurofarma did not face the 14% import tariff that applied to its foreign competitors.
In de Souza and Garber (2025), I argue that the case of Eurofarma reflects a broader pattern. Using administrative microdata from Brazil and a quasi-experimental design that compares near-winners to near-losers of R&D subsidy applications, we find that the programme had a persistent effect on firm size: fourteen years after receiving the subsidy, subsidised firms were 59% larger. The effect is strongest among small and young firms facing high borrowing costs, which is consistent with the subsidy alleviating financial constraints. This growth, however, did not come from firms developing frontier innovations. Instead, firms used the subsidy to expand their product lines into high-tariff markets, producing local versions of foreign goods.
Brazilian R&D subsidy: Technical assignment and cost control
The R&D subsidy programme, administered by the Funding Authority for Studies and Projects, operates with two defining features:
- Subsidies are allocated according to a set of technical criteria. The Authority issues thematic calls for proposals based on recommendations from a board of external consultants and academic researchers. Firms respond with submissions that are evaluated by panels of anonymous academic experts, who apply predetermined scoring metrics. This process ensures that selection is based solely on technical merit.
- Once the subsidy is awarded, firms have a two-year window to implement their projects under strict oversight from the Funding Authority. This oversight includes live bank audits, detailed expense reporting, customised cost-tracking software, and monitoring by dedicated audit teams.
To identify the effect of the R&D subsidy, we compare the trajectories of firms that applied for and received the subsidy to those of similar firms that had an equal chance of receiving it but were ultimately unsuccessful. Since the two groups differ only in subsidy receipt, any divergence in their outcomes after the subsidy can be attributed to the subsidy itself.
Persistent firm expansion by relaxing credit constraints
Figure 1 plots the effect of the R&D subsidy on firms’ wage bills over time. Each coefficient can be interpreted as the percentage increase in wage bill caused by the R&D subsidy. In year 0, firms began receiving funds. Over the subsequent two-year implementation period, their wage bills grew more rapidly than those of similar firms that applied but did not receive the subsidy. By year 3, the gap stabilised, with treated firms approximately 40% larger. Crucially, the gap persisted well beyond the end of public funding: a full 12 years after the initial grant, treated firms still maintained a wage bill roughly 40% higher than that of otherwise similar applicants who did not receive the subsidy.
Figure 1: Innovation subsidy led to a persistent increase in wage bill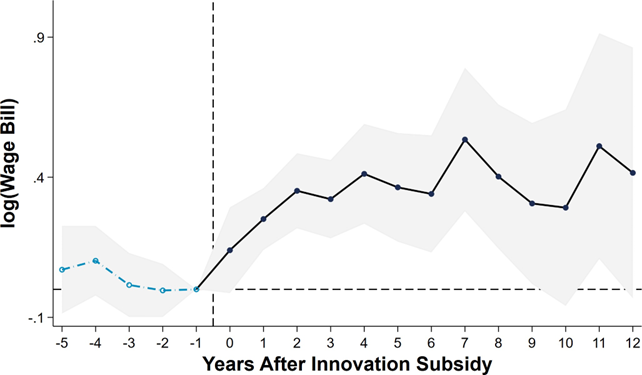
Why is the subsidy so effective in driving persistent increases in firm size? And why don’t control firms finance their ideas with private credit and catch up? Table 1 helps explain. The first two rows compare the size of the subsidy to the average investment loans received by firms, revealing a striking disparity: on average, R&D subsidies are 66 times larger than typical bank loans. The last two rows show that firms face a credit-weighted interest spread of 24% per year, which is below Brazil’s average of 45% (Cavalcanti et al. 2021), but still far above international levels, such as 3% in the US and 7.5% in Argentina.
Together, these numbers suggest that the subsidy enables sustained growth because bank credit is both too costly and too limited to support projects as large as the ones subsidised by the government.
Table 1: Subsidy applicants are financially constrained
| Statistic | Value |
| E [Subsidy/Yr. Wage Bill] | 10.18 |
| E [Investment Loans/Yr. Wage Bill] | 0.15 |
| Average Interest Rate on Bank Loans | 33.15% |
| Average Interest Rate Spread on Bank Loans | 24.23% |
More R&D, but not better R&D
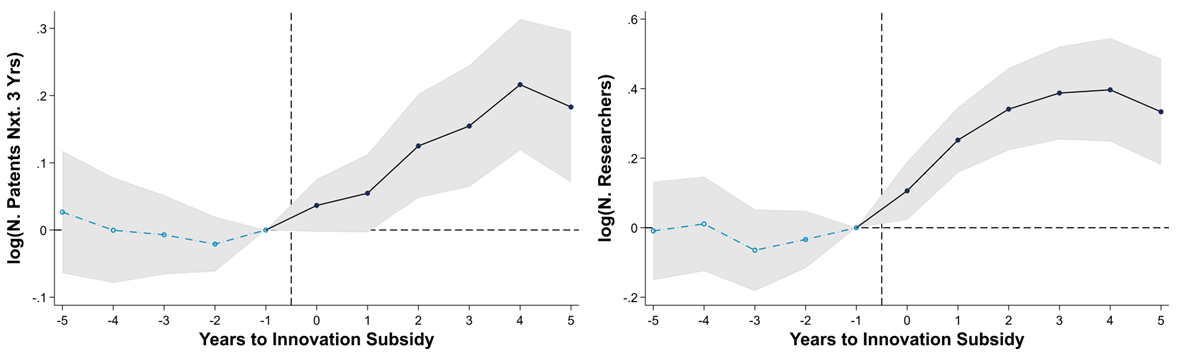
Figure 2 shows that firms used the R&D grant to hire more scientists and, as a result, increased their patent applications. However, the subsidy did not improve the quality of innovation: total citations, citation-weighted patents, and inventor quality remained unaffected. This pattern is consistent with the characteristics of the scientists hired. Most had no experience with R&D and often came from technical or operational roles. Together, these findings suggest that the development of breakthrough innovations is not what has driven the persistent increase in firm size discussed in the previous section.
Figure 2: Innovation subsidy increased patenting and hiring of scientists
(a) Number of patents in the next three years (b) Number of scientists
Growth through import substitution
How can firms dominate markets for over a decade with inventions that are rarely cited and developed by workers with little R&D experience? The answer lies in how the subsidy was used. It enabled firms to introduce new products and expand their product variety. These products share a key feature: they are all protected by high import tariffs in Brazil. This tariff protection shields firms from foreign competition, allowing them to grow and maintain market dominance despite producing low-impact innovations.
Adopting foreign technology for domestic import substitution
Firms are entering these high-tariff markets using foreign capital and ideas. Two pieces of evidence support this claim. First, the subsidy leads firms to cite more foreign patents and increase imports of high-tech machinery. Second, these two effects are correlated, as shown in Figure 3, which plots the percentage increase in patent citations against the percentage increase in machinery imports by source country. This pattern suggests that firms are importing both machines and ideas from the same countries, which is consistent with the interpretation that they are developing local versions of goods originally produced abroad.
Figure 3: Firms adopt machines and ideas from the same countries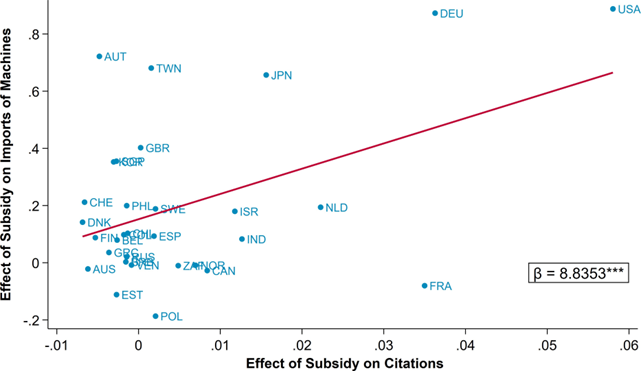
These products, created with ideas and machines from developed countries, are then shipped to countries with favourable tariffs against Brazil: destinations that impose low tariffs on Brazilian goods but high tariffs on imports from North America and Europe.
The subsidy’s impact is strongest in markets with higher tariffs on developed countries, where Brazilian firms face less direct competition from the very sources they draw their technology from (Figure 4). This pattern reinforces our finding that firms can expand exports without breakthrough innovations because foreign tariffs shield them from direct competition with the very ideas they are imitating.
Figure 4: Firms export to countries with high tariffs against North America and Europe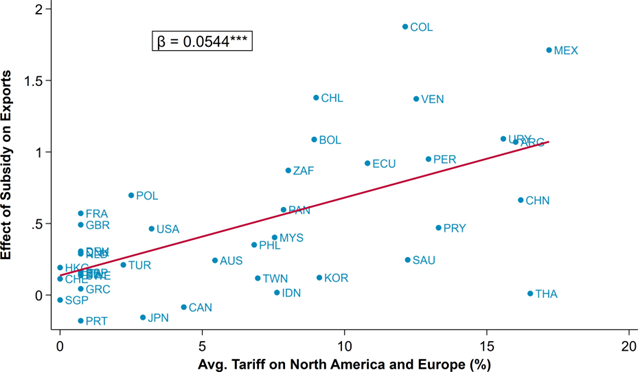
The R&D subsidy paid for itself
Despite leading to the development of low-impact innovations targeted at tariff-protected markets, the subsidy generated significant and persistent firm growth. Was this growth enough for the subsidy to pay for itself? We found that, under some restrictive assumptions, the effect of the subsidy was large enough for it to pay for itself. For every $1 of innovation subsidy, the government collected $2.2 in payroll taxes alone.
These results have two important policy implications. First, financial constraints in developing countries can be severe enough to prevent local firms from adopting foreign technologies, contributing to slower growth. Second, industrial policies such as R&D subsidies and import tariffs are more effective when implemented together. In the presence of large financial constraints, an increase in tariffs alone could not be enough to lead financially constrained firms to access the market protected by high import tariffs.
References
Caruso, C (2016), “Physicochemical and biological comparison of the first Brazilian biosimilar filgrastim with its reference product,” Biosimilars 6: 45–60.
Cavalcanti, T V, J P Kaboski, B S Martins, and C Santos (2021), “Dispersion in financing costs and development,” Unpublished manuscript.
De Souza, G and G Garber (2025), “R&D subsidy and import substitution: Growing in the shadow of protection,” Unpublished manuscript.
Finep (2015), “Finep financia desenvolvimento de remédio contra efeito de quimioterapia — inédito no país.”
Gabi (2016), “Filgrastim follow-on biological approved in Brazil.”