


New estimates of the social rates of return on investment in road infrastructure in emerging market and developing economies highlight substantial unrealised gains from redirecting advanced-economy savings towards public investment in developing countries.
Editor’s note: For a broader synthesis of themes covered in this article, check out our VoxDevLit on Land Transport Infrastructure. The authors have made slides available here.
Roughly one billion people live more than two kilometres from an all-season road. The vast majority reside in emerging market and developing economies (EMDEs), where inadequate transportation infrastructure constrains access to jobs, markets, schools, and healthcare (Rozenberg and Fay 2019). Poor road connectivity raises commercial costs, fragments labour markets, and limits structural transformation.
Since 2015, multilateral development banks have urged advanced-economy asset and pension-fund managers to boost private capital investment in the public infrastructure of EMDEs from ‘billions to trillions’. Despite favourable demographics and capital scarcity that support the textbook case for reallocating rich-country savings towards productive infrastructure investment, data, particularly in Africa, data reveals de minimus mobilisation of private finance for this purpose, even as overall foreign direct investment increased (Figure 1).
Sceptics will take this as proof that the hope of private savings flowing from rich countries at scale to finance public capital formation in the developing world is only that. They assert that low levels of education, poor governance, and the risk of expropriation mean, in practice, that the rate of return on capital in EMDEs has never been significantly higher than in advanced economies (Lucas 1990, Caselli and Feyrer 2007). This debate dates back to 1990, when late Nobel Laureate Robert Lucas asked: If capital is so scarce in developing countries, why doesn’t it flow there (Pellegrino et al. 2025)?
Bridging the information gap
One reason for the lack of uptake on the ‘billions to trillions’ tagline is that investors lack relevant, globally comparable evidence on the returns to infrastructure investment.
In recent work (Chari, Henry, and Picardo 2025), we attempt to calibrate the gap between hope and reality. Our initial findings are striking: controlling for a wide variety of factors, we estimate that the median social rate of return to building an additional kilometre of two-lane highway in EMDEs is 55% – with a mean of 97%.
The social rate of return on private capital in the US is about 7% (Caballero et al. 2017). Road investment in developing countries therefore appears to generate returns roughly eight to fourteen times greater.
This suggests large unrealised global benefits from reallocating the marginal dollar of private savings to finance investment in EMDE infrastructure: more jobs and higher wages for young people in the developing world; higher returns for retirees in advanced economies. The question is whether the magnitude of the differences is implausibly large.
Figure 1: ‘Billions to trillions’ has not significantly increased private participation in infrastructure investment
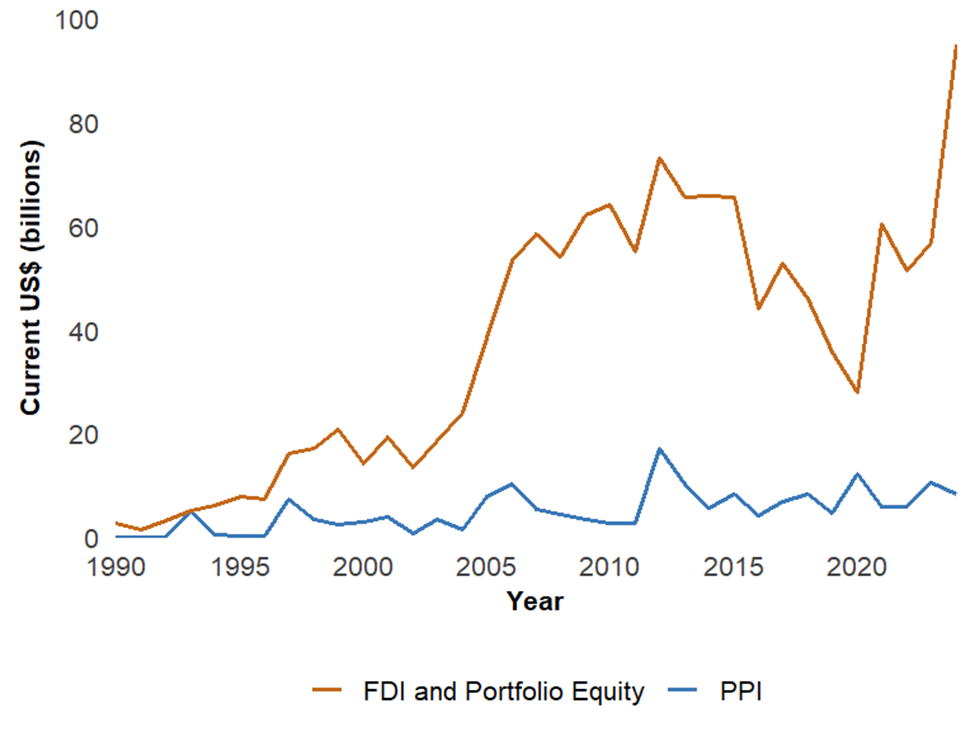
Note: Figure 1 compares the annual sum of portfolio equity net inflows and foreign direct investment (FDI) net inflows with the amount of private participation in infrastructure (PPI). The figure encompasses 54 countries in Africa. All values are reported in current US$ billions. Data on portfolio equity and FDI is from the World Development Indicators (World Bank 2026). PPI data is from the World Bank Private Participation in Infrastructure Projects database.
Emerging market equity funds: An instructive detour
In 1990, developing countries were on the verge of radical change in their investment landscapes. With the implementation of the Brady Plan and the fall of the Berlin Wall in 1989, government officials from Seoul to São Paulo began liberalising restrictions that had previously prohibited foreigners from owning stock in publicly traded domestic companies (Henry 2000, Henry 2013).
Before this change, aggregate valuations of developing country stock markets were so low that expected returns were 1.5 to 1.7 times higher than returns in markets such as the FTSE and S&P 500 (Chari et al. 2021). Additionally, a history of trade protectionism meant that developing country corporate earnings moved less in sync with advanced country corporate earnings than they do today. The combination of high expected returns and low correlation provided credible evidence of an arbitrage opportunity waiting to be exploited.
When barriers to foreign ownership toppled, asset managers in advanced economies established closed-end mutual funds for investment and rebranded the countries in which they traded as ‘emerging markets’. Inflows of portfolio equity, as well as FDI, soared (Figure 2), and a new asset class was born, now measured in trillions of dollars.
Figure 2: Net inflows of FDI and portfolio equity to developing countries soared after they eased restrictions on foreign ownership of domestic stocks in the late 1980s and early 1990s
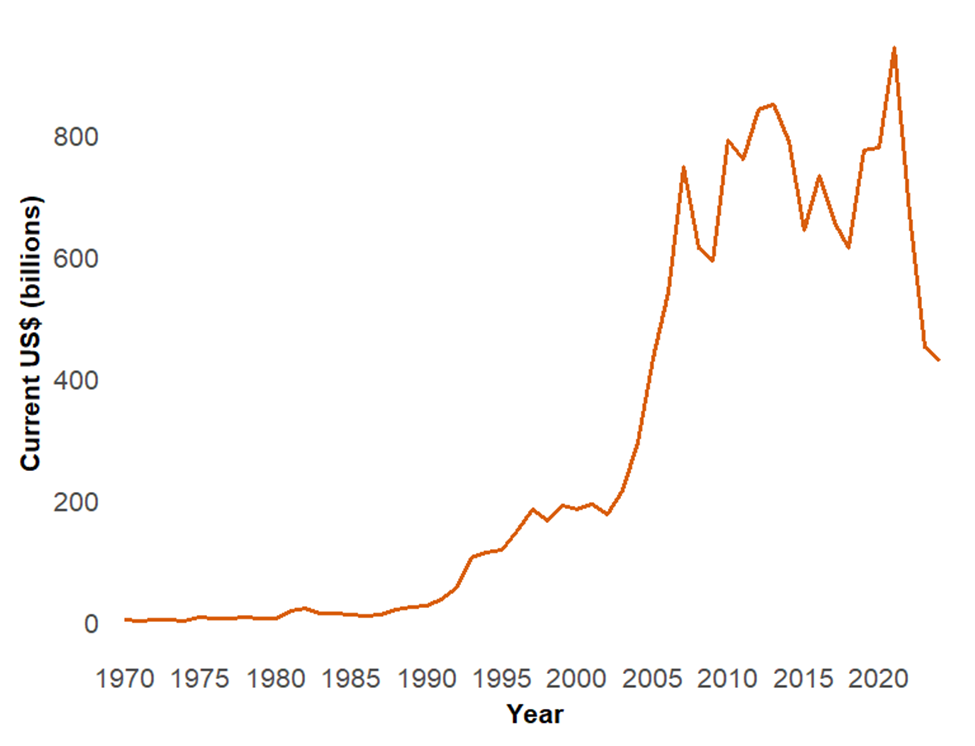
Note: Figure 2 is the yearly sum of the portfolio equity (net inflows) and foreign direct investment (net inflows) for EMDEs. All values are reported in current US$ billions. Data from the Development Indicators (World Bank 2026).
Today, risk-adjusted rates of return on private capital in developing countries are largely congruent with returns on US stocks. But there is no exchange on which buyers and sellers can trade claims to arbitrage away the difference between the return on public capital in developing countries and the return on the S&P 500.
For this to occur, at a minimum, the social return on infrastructure in developing countries must exceed the return on private capital in advanced economies by a multiple large enough to compensate for any risks of financing public capital formation in EMDEs (e.g. country, currency, project, or regulatory).
Measuring the multiple
To arrive at our estimated (at least eightfold) excess multiple, we examine paved roads, a first-order component of public capital, and use a standard production function framework with data from 1960–2019 to estimate country-specific social returns in fifty-five EMDEs in three steps.
- Employing standard econometric techniques to hold other productivity factors constant, we first estimate how much each country’s GDP increases when it increases its stock of roads by one percentage point. The GDP increase is called the elasticity of GDP with respect to roads.
- Using this elasticity in conjunction with the country’s other observed stocks of capital, we compute the marginal product of roads: the additional amount of GDP generated by building another kilometre of road.
- To convert the country’s marginal product into a rate of return, we divide the marginal product by the country-specific cost of constructing another kilometre of two-lane highway. Finally, since roads depreciate by about 7% per year, we subtract 7% from the quotient to obtain our estimate of the rate of return.
Estimating the cost of construction in fifty-five different countries is a non-trivial task. The World Bank’s Roads Cost Knowledge System (ROCKS) contains detailed project-level data, but relatively few countries report costs for standard ‘new two-lane highways’. Where countries lack direct observations, we construct hedonic cost estimates using relative price relationships across different road projects (rehabilitation, upgrading, widening, etc.) to infer the likely cost of building a new two-lane highway.
Converting all construction costs into inflation-adjusted US dollars (USD) results in a dataset that allows for consistent cross-country calculation and comparison of rates of return.
High marginal products, great variability
The marginal product of roads in EMDEs is higher than in developed countries, but also quite variable, ranging from more than US$4 million in the Philippines to US$0.4 million for Namibia.
Construction costs also vary widely, from $0.5 million per kilometre in Mongolia to $3.2 million in Nigeria. Income levels alone do not explain cost differences. Some middle-income countries have relatively low costs, while some poorer countries face high expenses due to constraints such as geography, conflict exposure, governance, and/or project complexity.
Variability in marginal products and construction costs means that returns are widely dispersed across countries – from 230% in the Philippines to less than 30% in Cameroon. Furthermore, a large marginal product need not imply a large return. Mountainous Bolivia has an above-average marginal product of $1.7 million, but its construction cost exceeds $3 million, so Bolivia’s social rate of return to roads is 48% – half the EMDE mean.
Paving a profitable road: Potential and policy priorities
Size and precision of the estimates vary widely across countries. Nevertheless, the eightfold excess social return on roads is five times larger than the excess financial return on stocks in developing countries that catalysed emerging market equity as an asset class (Gardner and Henry 2023).
If the estimates are anywhere close to being correct, the question is not whether the potential gains to developing EMDE infrastructure as an asset class are large, but how we prioritise projects and design institutions and financing structures that allow investors to share in the gains.
High social returns alone will not mobilise private capital for development. Institutional reforms that improve contract enforcement, reduce political risk, and enhance transparency are critical for converting high social return investments into bankable projects. Improved cost measurement, greater use of geospatial data, and integration of macro, micro, and financial approaches can also sharpen investment decisions.
With more quality data and investment-friendly policies to bridge the gap, we may yet incentivise the private financing of public capital formation in EMDEs and address the most consequential development challenge of the 21st century (Chari et al. 2025b, Chari et al. 2025c).
References
Caballero, R J, E Farhi, and P-O Gourinchas (2017), "Rents, technical change, and risk premia accounting for secular trends in interest rates, returns on capital, earning yields, and factor shares," American Economic Review, 107(5): 614–20.
Caselli, F, and J Feyrer (2007), "The marginal product of capital," Quarterly Journal of Economics, 122(2): 535–568.
Chari, A, P B Henry, and P A Picardo (2025a), "The social rate of return on road infrastructure investments," Unpublished manuscript.
Chari, A, P B Henry, and P Mauro (2025b), "Financial returns on equity investments in infrastructure in emerging markets and developing economies," Unpublished manuscript.
Chari, A, P B Henry, Y Lee, and P Mauro (2025c), "Financial returns to equity investments in infrastructure in emerging-market and developing economies," Unpublished manuscript.
Chari, A, P B Henry, and H Reyes (2021), "The Baker hypothesis: Stabilization, structural reforms, and economic growth," Journal of Economic Perspectives, 35(3): 83–108.
Gardner, C, and P B Henry (2023), "The global infrastructure challenge: Potential, perils, and a framework for distinction," Journal of Economic Literature, 61(4): 1318–1358.
Henry, P B (2000), "Stock market liberalization, economic reform, and emerging market equity prices," Journal of Finance, 55(2): 529–564.
Henry, P B (2013), Turnaround: Third world lessons for first world growth, New York: Basic Books.
Lucas, R E (1990), "Why doesn't capital flow from rich to poor countries?" American Economic Review, 80(2): 92–96.
Pellegrino, B, E Spolaore, and R Wacziarg (2025), "Barriers to global capital allocation," Quarterly Journal of Economics, 140(4): 3067–3131.
Rozenberg, J, and M Fay (2019), "Beyond the gap: How countries can afford the infrastructure they need while protecting the planet," World Bank.