


Collecting data using multiple survey methods can mitigate data errors that magnify the differences between low- and high-productivity farms
Research shows that firms in the same sector vary widely in their productivity (Hsieh and Klenow 2009, Syverson 2011). That is, even among firms producing the same type of goods, some firms are much more efficient at converting inputs into output (revenue) than others.
Empirically, the gap in measured productivity between high- and low-productivity firms - often referred to as productivity dispersion - has been linked to aggregate economic performance and growth over time, with more productive firms being more likely to grow and survive. As such, measuring and understanding productivity differences has been of critical interest to policy makers and researchers seeking to foster and understand economic development.
Most research on productivity uses data from manufacturing firms in developed countries. Yet in many developing countries, small family-owned farms are the most common type of firm and the majority employer in the economy. For example, according to the World Bank’s Development Indicators, among countries classified as ‘Low Income’ over 61% of the total labour force was employed in agriculture in 2017 (World Bank 2020). Furthermore, approximately 60% of the world’s poor are estimated to reside in smallholder farm households (Christen and Anderson 2013).
Productivity dynamics and agricultural development policy
The productivity dynamics of smallholder firms are still not well understood. Is the magnitude of productivity dispersion among smallholder farms similar to what has been documented among manufacturing firms? And are differences in farm productivity persistent over time?
Answering these questions can help determine what type of policies are most likely to be effective in promoting agricultural development in developing countries. For instance, if the productivity dispersion is large, then facilitating the reallocation of land from low- to high-productivity farmers (perhaps through improved property rights) could significantly increase aggregate efficiency (Restuccia and Santaeulalia-llopis 2017). If productivity is highly persistent, then one-off interventions that boost productivity in the short run (such as cash grants or input subsidies) may also have lasting impacts.
The sources of differences in farms’ productivity also matter. For example, productivity differences could primarily reflect differences in farmers’ access to technology or information. Alternatively, they could reflect differences in farmers’ managerial ability. Each of these would imply different policy responses.
Measuring smallholder farm producitivity
At the same time, accurately measuring productivity using agricultural survey data is difficult. Smallholders often lack formal records, typically cultivate multiple plots and crops, harvest at multiple times, and can be surveyed weeks or months after harvesting their fields.
Unsurprisingly, these factors make it difficult to accurately quantify the number of crops farmers produce and the amount of inputs they use on each plot. Any resulting inaccuracies can distort the estimates of productivity derived from them, causing researchers to misinterpret or overstate the implications of observed productivity dynamics.
Accounting for such measurement errors is therefore critical to making accurate inferences about productivity. Only recently have researchers sought to disentangle the importance of measurement error from other explanations for productivity dispersion (Bils et al. 2020, Gollin and Udry 2019).
The study: Measuring agricultural productivity in sub-Saharan Africa
In new research, we study the productivity dynamics of more than 12,000 smallholder farms in Ethiopia, Nigeria, Tanzania, and Uganda using agricultural survey data collected by the World Bank over the period from 2008-2015 (see the map in Figure 1).
These data contain detailed information on inputs and outputs across agricultural plots cultivated by each household, with most households tracked and re-interviewed across multiple years. We use these rich data to implement multiple approaches for correcting for potential measurement error in both inputs and outputs, and show how these corrections substantially affect our understanding of productivity patterns.
Productivity persistence and dispersion: Measurement error
“Naive” estimates, which ignore measurement error, suggest that productivity differences across farmers are massive in a given year, but not very persistent across years. For persistence, we calculate how strongly correlated households’ productivity is across survey waves and convert these correlations to annualised (year-on-year) values. Using this approach, dispersion among the smallholder farms in our data is a factor of 1.2-2.0 times greater than benchmark estimates from manufacturing firms, and the persistence of productivity is 50% lower.
Correcting for measurement error changes the results substantially. To do this, we make use of the fact that in subsets of the data, agricultural inputs and output used or produced on the same plot were measured using multiple survey methods. For example, survey enumerators both asked farmers to estimate the size of their plots, then also independently measured plot area using Global Positioning System (GPS) devices.
From these multiple measures of inputs and output, we then derive multiple estimates of productivity for the same plot. Under the assumption that measurement errors are random, these multiple estimates of productivity represent noisy measures of farms’ “true” underlying productivity.
By comparing these measures across farms and within farms over time we can put bounds on how much measurement error contributes to naively measured productivity dispersion and generate “measurement-error-corrected” estimates of persistence.
The findings: Smallholder farms versus manufacturing productivity
Using this novel approach, we find estimates of productivity dispersion that are at least 37% lower, and estimates of persistence that are twice as high. After correcting for measurement error, productivity differences across firms and over time in our smallholder agricultural setting closely match benchmark estimates for non-agricultural firms (see Figure 1).
Figure 1 Study locations and productivity dispersion and persistence between smallholders farmers and manufacturing
Correcting for measurement error, productivity dynamics of smallholder farmers appear similar to benchmark estimates from manufacturing.
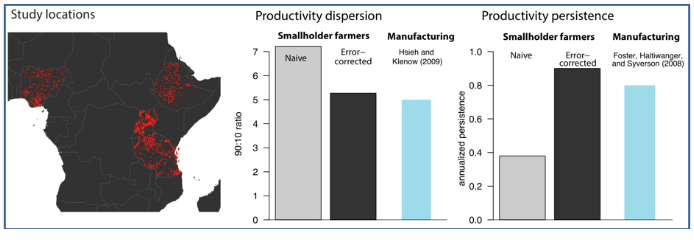
Source: The map shows the location of households in the study based on the World Bank’s Living Standards Measurement Study Integrated Surveys on Agriculture (LSMS-ISA) programme (CSA 2017, NGA-NBS 2017, TZ-NPS 2016, UBS 2015).
Implications: Policy and survey design
- Measurement error significantly magnifies the size of the differences between low- and high-productivity farms in agricultural survey data.
The hypothetical efficiency gains associated with policies that seek to reallocate inputs (such as land) from low- to high-productivity farms may be significantly overstated. Policy makers should thus approach such policies cautiously and implement them only after considering measurement error in the evaluation of their potential benefits.
- After correcting for measurement error, the data indicates that farms’ productivity is highly persistent over time.
This implies that the least productive farms tend to have low productivity year after year. Given that subsistence agricultural is the predominant occupation of the poor, social support policies designed explicitly for smallholder farmers could effectively target poverty outcomes.
In addition, the fact that productivity appears persistent supports the notion that interventions that provide a one-time boost to farms' productivity (such as cash grants or input subsidies) can potentially break farmers out of cycles of low productivity and contribute to lasting productivity gains.
- The effects of measurement error in agricultural survey data can be quantified if information is collected using multiple different survey methods.
Implementing multiple measurement approaches for a broad set of quantities of interest should thus be a goal in the design of future survey instruments.
References
Bils, M, P J Klenow and C Ruane (2020), “Misallocation or Mismeasurement?”, NBER Working Paper 26711.
Christen, R P and J Anderson (2013), “Segmentation of Smallholder Households: Meeting the Range of Financial Needs in Agricultural Families”, CGAP Focus Note No. 85.
Gollin, D and C Udry (2019), “Heterogeneity, Measurement Error, and Misallocation: Evidence from African Agriculture”, Global Poverty Research Lab Working Paper No. 18-108.
Hsieh, C-T and P J Klenow (2009), “Misallocation and Manufacturing TFP in China and India”, The Quarterly Journal of Economics 124(4): 1403–1448.
Restuccia, D and R Santaeulalia-Llopis (2017), “Land Misallocation and Productivity”, NBER Working Paper No. 23128.
Syverson, C (2011), “What determines productivity?”, Journal of Economic Literature 49(2): 326–365.
UBS – Uganda Bureau of Statistics (2015), Uganda National Panel Survey (UNPS), Waves 1-5 (2005-2014), Public Use Datasets (datasets downloaded from www.microdata.worldbank.org on 31 March 31 2020).
World Bank (2020), World Development Indicators Online database.