

Redistributive policies may exclude the poor because they can’t apply, and fixing this requires alleviating multiple constraints
Governments often want to redistribute in kind through public services
Governments routinely attempt to promote social equity by prioritising poorer citizens in the delivery of essential services — such as housing, healthcare and education, where private providers often account for a large market share. In practice, however, common interventions like price caps, targeted subsidies or quotas may disproportionately benefit better-off households, undermining stated goals of fairer allocation. Since taxpayers prioritise fairness and redistribution concerns when evaluating policy proposals (Stantcheva 2021), such regressivity could also undermine popular support. Thus, a central concern for all social policy is to assess the de facto incidence of programme benefits and, in many instances, how to make it more progressive.
Private school quotas in India’s Right to Education Act
In a recent working paper (Romero and Singh 2023), we study the incidence of one of the world's largest affirmative action policies in schooling: a quota of 25% of the student intake in all Indian private schools for students from disadvantaged economic and caste backgrounds. In India, as in other low- and middle-income countries, private schools are common and differentiated in quality (e.g. Muralidharan and Sundararaman 2015, Urquiola 2016, Andrabi et al. 2022). The Right to Education (RTE) Act 2009 imposed the quota to reduce stratification due to selective admissions and parents' differential ability to pay. The state pays tuition fees for children enrolled under this quota (up to a cap) and schools are not allowed to select which students they admit or charge top-up fees. In 2018/19, approximately 4 million students nationwide used a quota seat to attend private schools (Indus Action 2019). Our setting is, thus, substantively important in itself and also typical of education policy interventions globally. We evaluate the effects of this policy in Chhattisgarh, a state of around 29 million people, which uses a centralised mechanism to allocate quota seats, with lottery-based allocation of oversubscribed seats.
Does the programme foster social mobility through school choice?
Being allotted an RTE quota seat increases the probability of attending any private school by 25 percentage points (i.e. the extensive margin of private school enrolment). However, about 75% of applicants who were not assigned an RTE seat also attend private schools by paying regular fees (virtually all students offered an RTE seat attend private schools). Further, approximately 50% of applicants in Grade 1 who lose the lottery for their top-choice school nevertheless attend the same school as fee-paying students. Some students use the quota seat to upgrade within the private sector (i.e. the intensive margin of private schooling). Schools attended by lottery-winners are more likely to have English-medium instruction, rank higher in parents' applications, and are more expensive. Given that many quota beneficiaries would have attended (the same) private school anyway, the policy has muted effects on diversity.
How efficient is public spending on the quota seats?
Students with an RTE seat in Grade 1 attend schools that, on average, charge 48% higher annual fees (a USD 38 increase over a control mean of USD 79). This treatment effect is 50% of the average fee reimbursed by the state; thus, half of the public spending per seat is effectively a cash transfer to households. The full programme cost is higher since 30% of schools charge fees higher than the government reimbursements cap (roughly $93 USD per year). Valuing quota seats at the full price paid by non-quota students, about 67% of the expenditure on a quota seat is a transfer to households that does not affect school choice (i.e. is “inframarginal”).
This inframarginality is explained by the selection of who applies, within the eligible groups, for the quota seats. While allocations are randomised, the decision to apply is not! Quota applicants have more household assets and parental education than households with similarly-aged children in representative data, both in the overall state population and within eligible caste groups. Applicants are also three times more likely to enrol in private schools without a quota seat than the state average among children from eligible castes. We show that 7.4% of the programme spending accrues to the bottom socioeconomic quintile, while 24.3% of spending accrues to households in the top quintile (see Figure 1).
Why don’t poorer eligible households apply?
This selection in applications could result from many different causes: maybe poorer households did not want to send their kids to private school, perhaps expecting their children to be less likely to make friends or get attention from teachers; perhaps they lacked information about the policy or how to apply; or, perhaps, they found the application process itself much more cumbersome and harder to navigate than richer households. Which of these explanations apply is crucial for understanding how applications could be made more progressive (or whether the policy itself is misguided). We collected rich survey data from all parents of young children in selected urban and rural communities to answer this question.
Put simply, demand for private schooling is very high even for poor households, and everyone has positive expectations of how their child will fare there. A lot of households are financially constrained (which we elicit using a stated choice exercise similar to Delavande and Zafar (2020)), justifying the basic policy rationale. In contrast, information constraints and barriers to applying are much more salient. Only 20% of households at the bottom-end of the socioeconomic distribution report having heard of the policy, compared to 65% at the top. Applications are mostly done online, but poorer households are also less likely to have internet access and are less familiar with navigating online application portals.
Figure 1: Applications, admission, and expenditure by SES quintiles
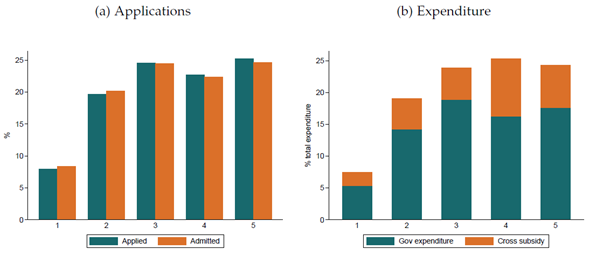
Notes: Figure 1a shows the proportion of students that apply and are admitted for an RTE seat that belong to each quintile of the state-wide SES distribution. Quintiles of socioeconomic status are computed based on household ownership of consumer durables and assets which are collected both in the representative National Family and Health Survey 2019-21 for the state-wide population and also in our survey of aplicants. Figure 1b shows the proportion of total costs of RTE quota seats (divided by the reimbursement of the fees given by the government and the cross-subsidy provided by schools if their fees are above the cap on reimbursements) that goes to each quintile of the SES distribution.
Will providing information and application assistance be enough to address regressivity?
We conducted a field experiment — that provided information and application assistance to randomly-selected households — to investigate whether relaxing these constraints would suffice to address the regressive selection of applicants. The intervention boosted application rates for the RTE quota by 43% (9.5 percentage points over a control mean of 22%). However, it did not reduce regressive selection: treatment gains were larger for above-median households, even though information constraints and barriers to applying online were more severe for poorer households (see figure 2). This counter-intuitive result reflects a further regressive constraint: the administrative burden of certifying eligibility. Richer households were more likely to have all documents --- 56% for the top decile compared to 24% in the bottom decile --- which largely reflects difficulty in obtaining documents rather than “true” ineligibility. This inability of willing poor households to submit applications provides a stark illustration of how an “O-ring” process (Kremer, 1993) contributes to regressive selection. Successful applications require all constraints to be satisfied simultaneously, and all constraints in our setting affect poorer households more.
Figure 2: Treatment effects of application support by SES quintile
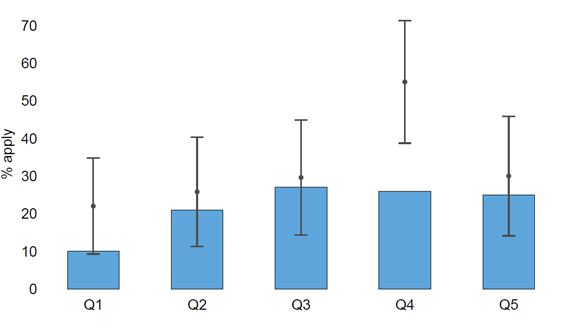
Notes: This figure plots the likelihood that households apply for an RTE seat by quintile in the socio-economic distribution. The bars correspond to the control group mean in each quintile. Above each bar we present the mean in the treatment group (along with the confidence interval) in each quintile.
What do we learn from all of this?
Most of all, our paper provides evidence of how even policies intended to be redistributive may be undermined and made regressive by selection into applications: this is despite substantial government attention to both policy formulation and implementation, and substantial latent demand for private schooling even from the poorest households. We not only show that this policy — which, as potentially the world’s largest school integration policy in schooling, is important in itself — is regressive as currently implemented, but also why that is the case.
Importantly, this does not mean that the policy is misguided. Our paper (Romero and Singh 2023) shows that the basic premise of the policy — that poorer and disadvantaged caste households want to go to private schools but are financially constrained — is correct. Take-up is regressive mainly due to constraints like information, application frictions and documentation. Supplementary interventions addressing these constraints can raise application rates dramatically — and, if they target all frictions or are combined with better targeting, they can make take-up progressive as well. Designing and implementing scalable interventions to achieve this may have substantial returns for policy effectiveness and welfare.
References
Delavande, A and B Zafar (2019), "University choice: The role of expected earnings, nonpecuniary outcomes, and financial constraints." Journal of Political Economy, 127(5): 2343-2393.
Indus Action (2019), “The Bright Spots Report: Status of social inclusion through RTE Section 12(1)(c),” Tech. rep., Indus Action.
Kremer, M (1993), "The O-ring theory of economic development." The Quarterly Journal of Economics, 108(3): 551-575.
Romero, M and A Singh (2023), "The incidence of affirmative action: Evidence from quotas in private schools in India." Working paper, Available here.
Stantcheva, S (2021), "Understanding tax policy: How do people reason?" The Quarterly Journal of Economics, 136(4): 2309-2369.