


Access to finance improved firm performance, product quality and price, but disadvantaged competitor firms
Lack of credit to firms is widely believed to be a barrier to growth, and a burgeoning literature shows that credit has positive effects on borrowing firms (e.g. De Mel, McKenzie and Woodruff 2008, Banerjee and Duflo 2014). However, credit can have indirect effects on other actors, such as peer firms through business stealing, information diffusion, and other channels, as well as on consumers through improvements in quality and price. Such indirect effects can be important for welfare and redistribution, but at present we have limited evidence on their nature and magnitude. Rotemberg (2019) documents a negative indirect effect on peer firms of a subsidy policy in India, and McKenzie and Puerto (2021) document no indirect effect on peer firms of a microenterprise training experiment in Kenya. We know little about the various indirect effects of credit – on both peer firms and consumers – and about the underlying mechanisms.
Identifying indirect effects using cross-market variation in access to credit
To better understand the indirect effects of credit, we conducted a field experiment with 3,173 firms in China (Cai and Szeidl 2022). We worked with retail and service firms (shops) organised in 78 local markets pre-defined by the local government, specialising in broad product categories such as furniture, building materials, clothing and shoes, and so on. On average, our firms had nine employees and annual revenue of about half a million US dollars.
Our treatment consisted of providing access to a new loan product introduced by our partner bank. The main advantage of the new product for borrowers relative to existing alternatives was that it did not require collateral, which mattered because firms in our sample typically did not own their stores. To measure indirect effects, we created randomised variation in treatment intensity across markets. Figure 1 shows the concept of our design: in 31 markets, we treated no firms; in 10 markets we treated 50% of the firms; and in 37 markets we treated 80% of the firms. This design enabled us to measure direct effects by exploiting within-market variation in a firm’s treatment status, and indirect effects by exploiting across-market variation in the share of the firm’s peers that were treated.
Figure 1 Experimental design
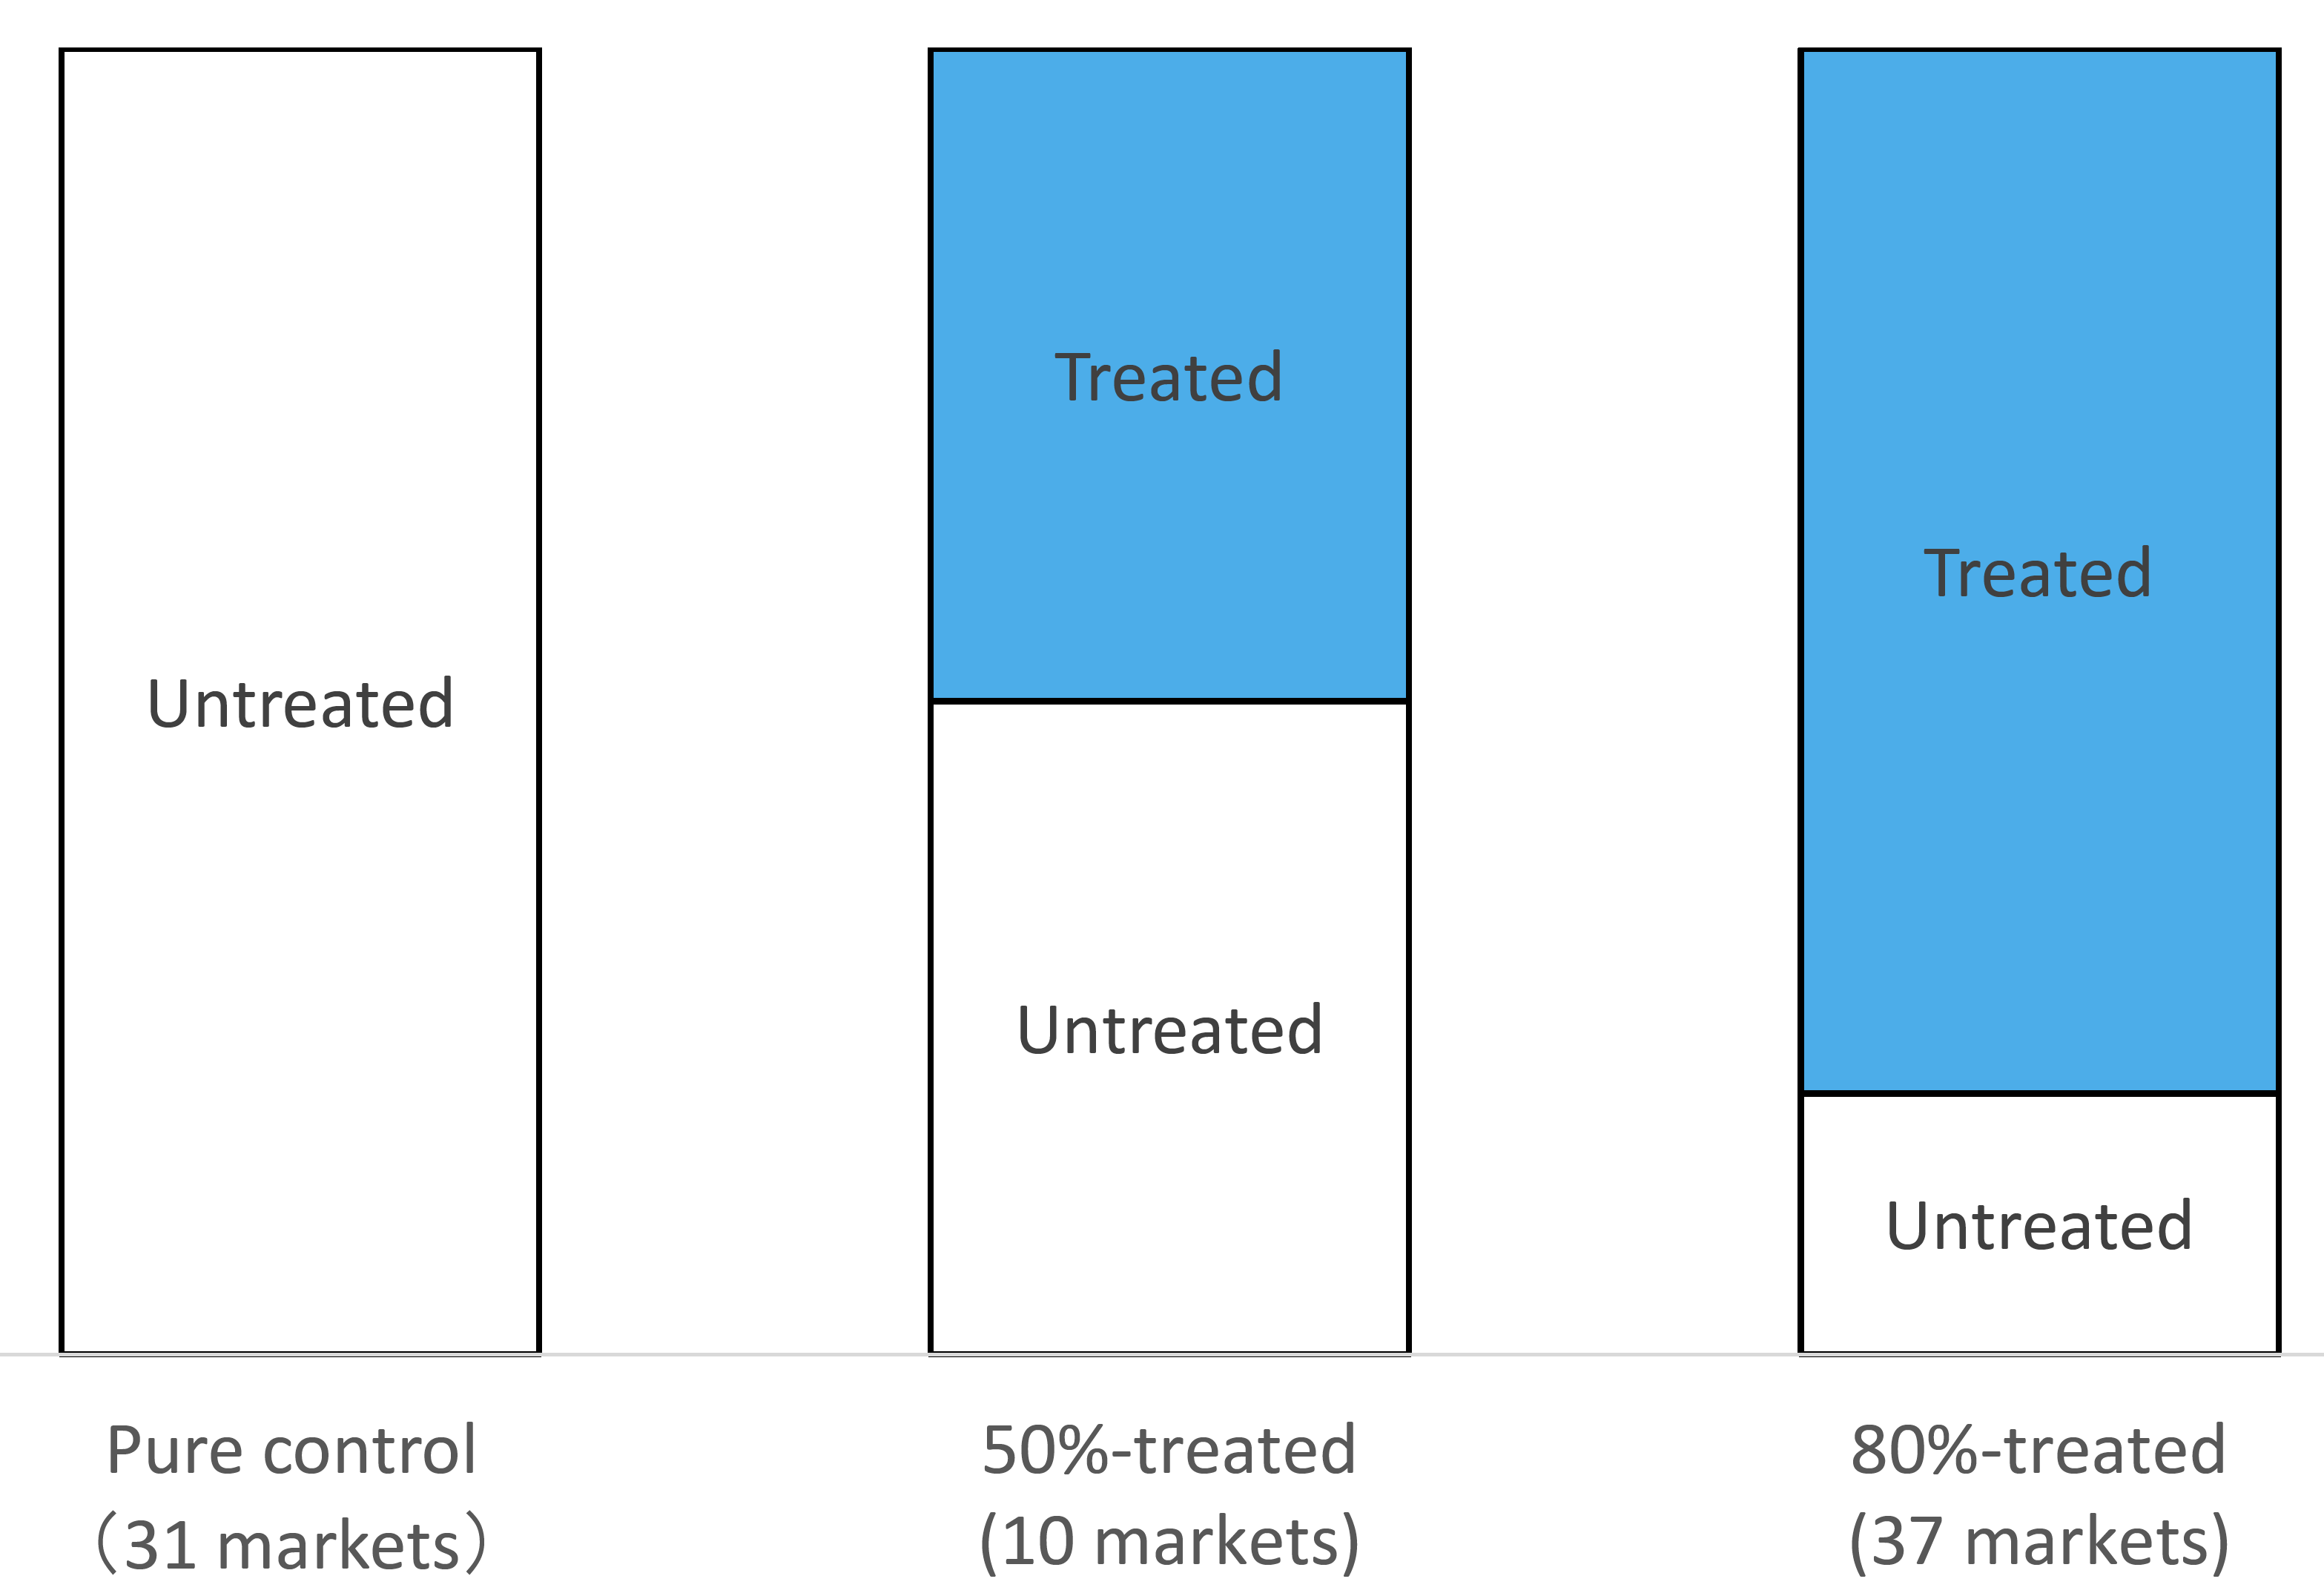
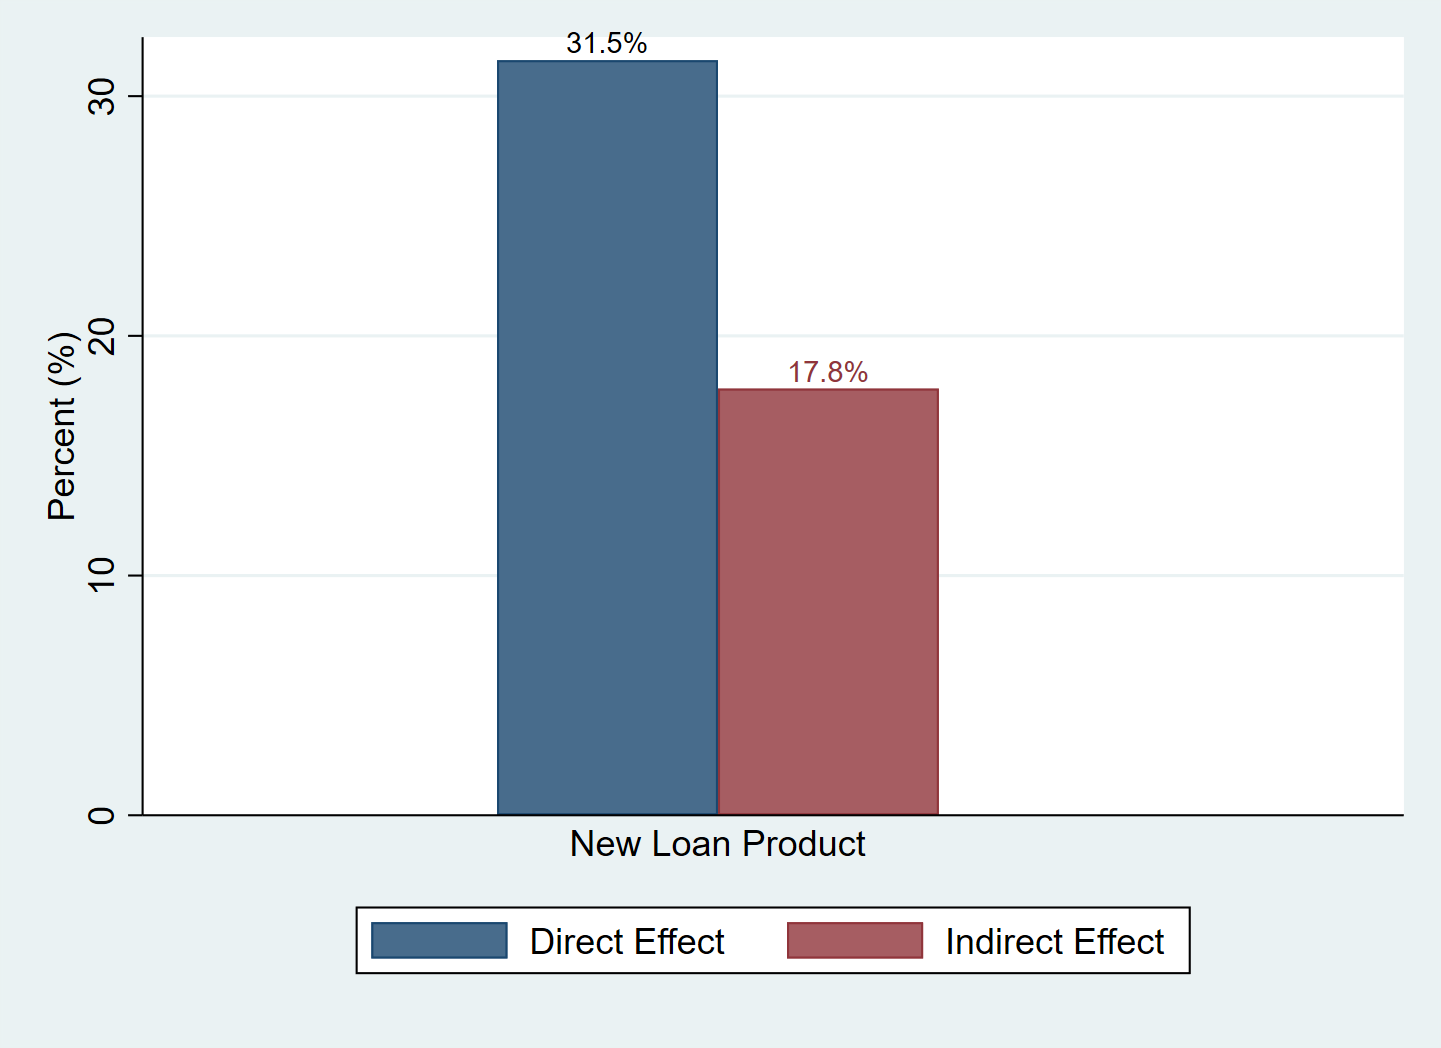
Figure 2 shows direct and indirect treatment effects on take-up, i.e., on borrowing using the new loan product. The blue bar measures the direct effect and implies that the treatment increased the probability of borrowing using the new loan product by about 32 percentage points. Thus, firms found the new loan advantageous. The red bar measures the indirect effect and implies that increasing the share of a firm’s peers that are treated from zero to 100% would increase the probability that a firm borrows by about 18 percentage points. This positive indirect effect suggests that knowledge about the loan product diffused through business and neighbourhood networks.
Figure 2 Direct and indirect effects on borrowing
Effects on firm performance
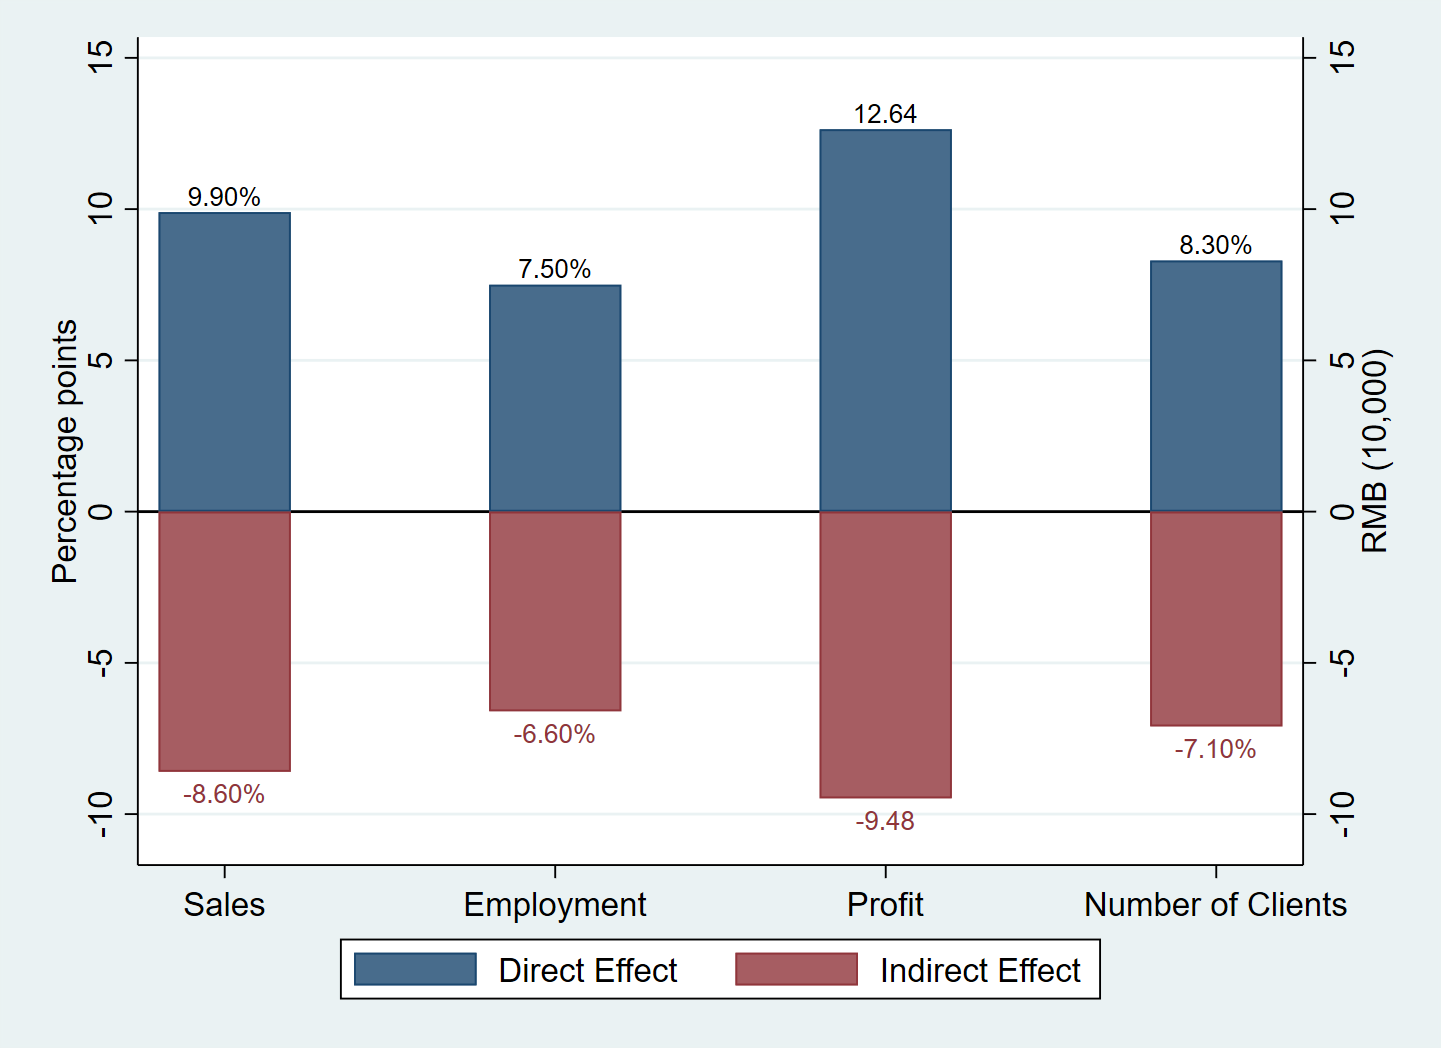
Figure 3 shows the estimated direct and indirect effects on four headline measures of firm performance. Exploiting the two sources of randomised variation in our design, we estimate the direct effect as the impact of the firm getting the treatment, and the indirect effect as the impact of the share of the firm’s competitors getting the treatment. The first pair of columns describe firm revenue. The blue bar shows a positive direct effect: the treatment increases firm revenue by about 10%. The red bar shows a negative indirect effect: increasing the share of competitors treated from zero to 100% would reduce firm revenue by about 9%. These direct and indirect effects nearly offset each other. For example, treating all firms in a market would imply that on average, all of them get both the positive direct and the negative indirect effect, implying a small (and insignificant) market-level effect. We observe similar offsetting effects for employment, profit, and number of clients. The natural interpretation of these results is business stealing – as treated firms took advantage of the loan, they attracted clients from their competitors, generating a within-market reallocation.
Figure 3 Direct and indirect effects on firm performance
Channel of reallocation
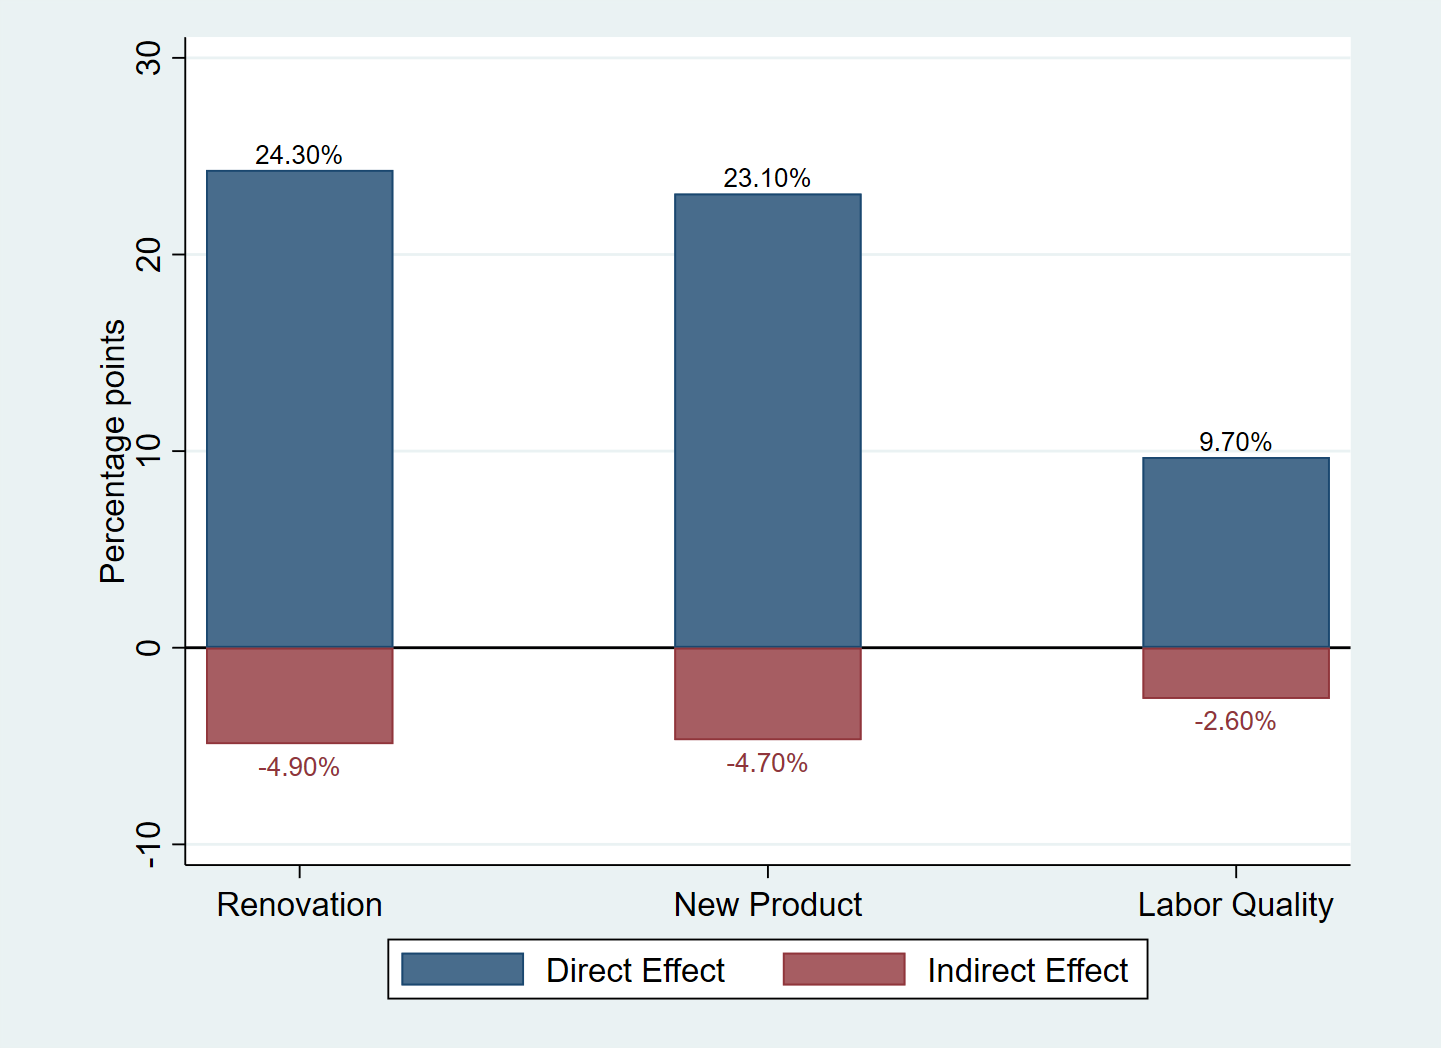
In Figure 4, we explore the mechanism behind this reallocation. The three outcomes measure business practices which reflect business quality: renovation, new product introduction, and the quality of the labour force (share of workers with a high-school degree). In all three of these outcomes, we observe a large positive direct effect, suggesting that treated firms used the loan to improve quality. Indirect effects for these outcomes are much smaller, indicating market-wide quality improvements.
Figure 4 Effects on business practices
Impact on consumers
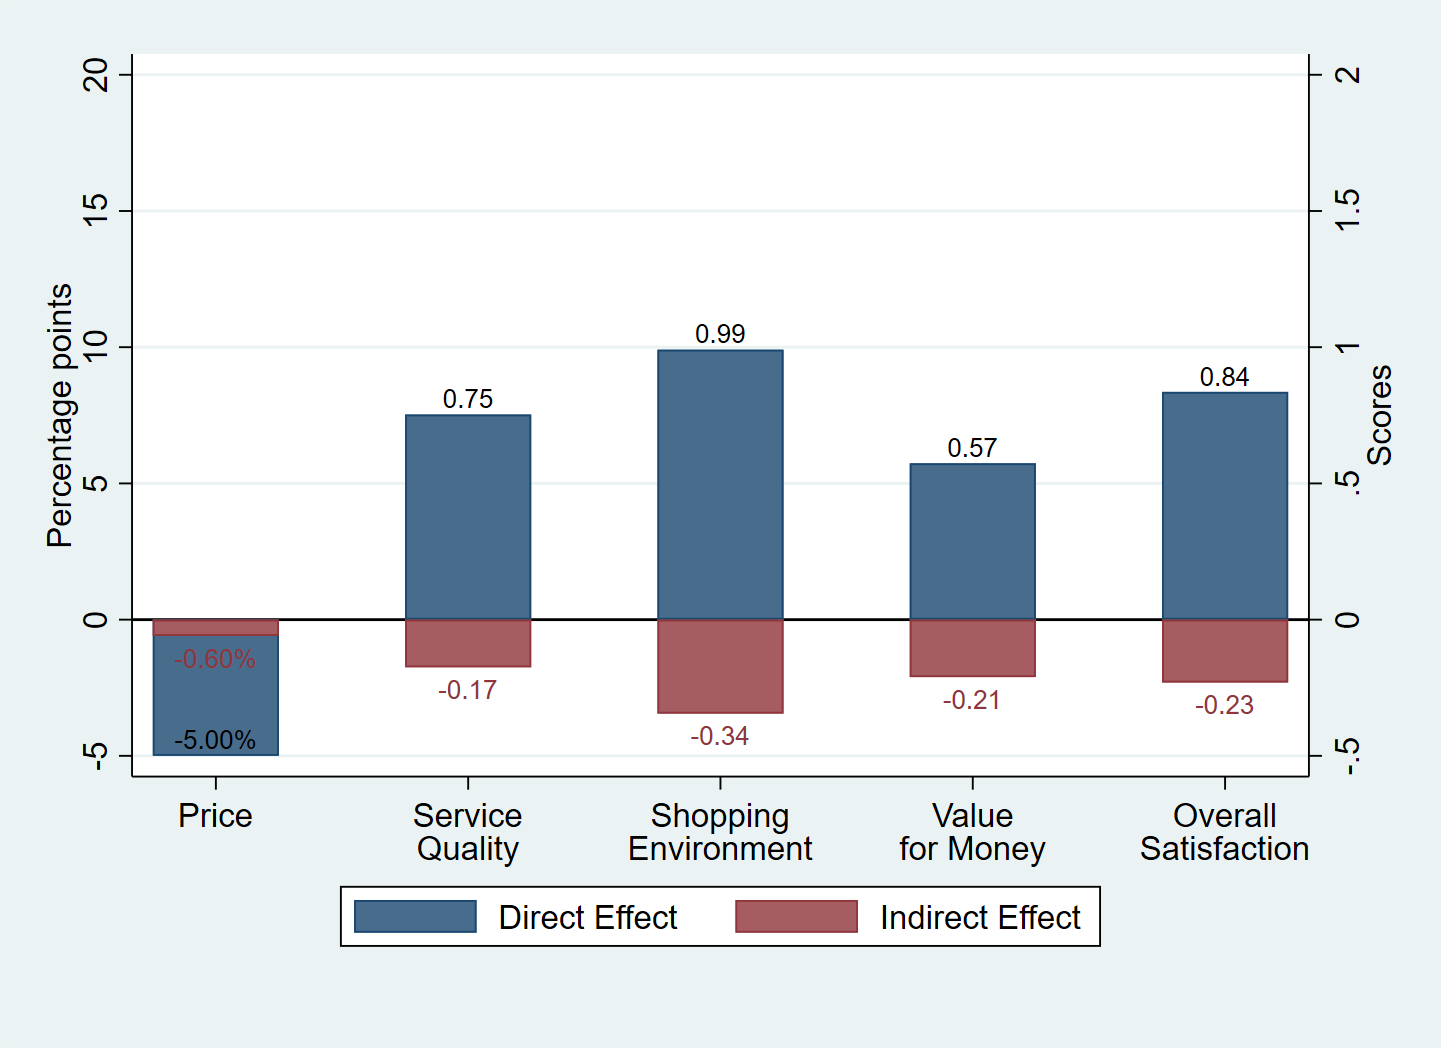
To investigate whether the changes in practices improved consumer satisfaction, in Figure 5 we turn to measures of consumer experience. In one of our surveys, we collected data on price and on consumer experience measured with the evaluation of a randomly chosen customer. For price, we estimate a negative direct effect and no indirect effect. For each dimension of consumer experience, and for an index of overall consumer satisfaction, we estimate a positive direct effect, and a much smaller and less significant indirect effect. We conclude that consumers valued the improved practices enabled by the loan, highlighting a plausible mechanism behind the reallocation.
Figure 5 Effects on consumer experience
Return on capital
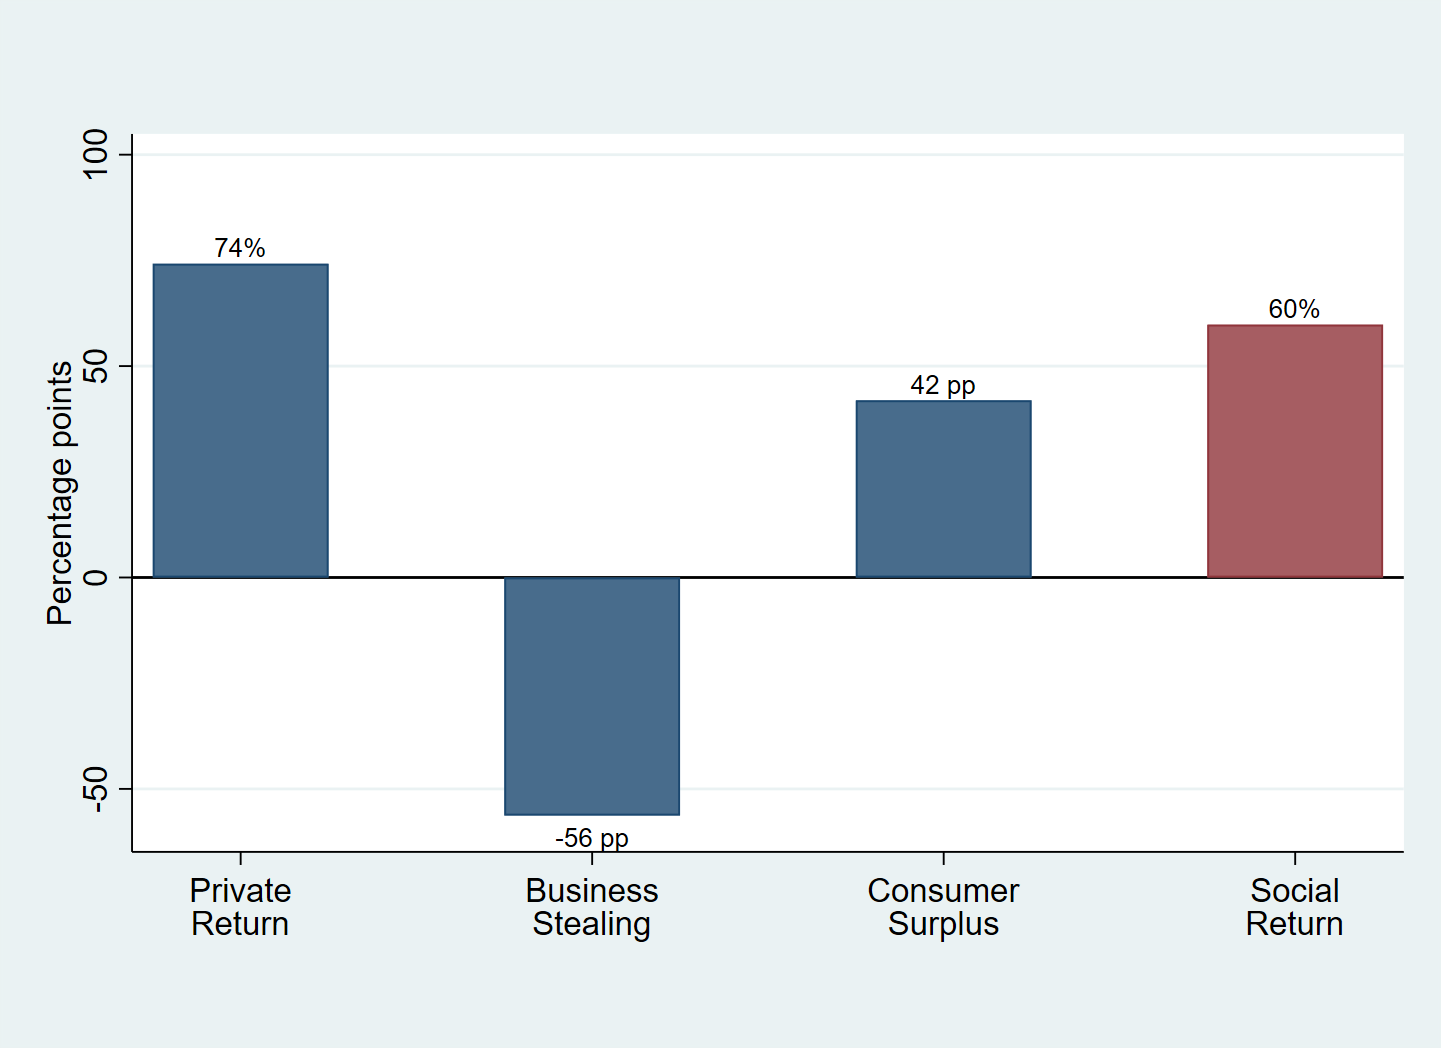
We combine our estimates of the various direct and indirect effects to compute the implied private and social return on capital. Figure 6 shows these results. We estimate that the private return to capital accumulating to the borrower firm and the bank was about 74% per year. This return may seem high, but it is consistent with other estimates of the return to capital in small firms (De Mel et al. 2008, Banerjee and Duflo 2014). However, most of this high return was cancelled by losses at competitors, which account for -56 percentage points. Adding in gains to consumers of 42 percentage points – which we can infer from the extent of reallocation – we estimate the social return to capital to be 60%. Thus, capital has very high returns, but in the context studied, returns are earned mainly by consumers.
Figure 6 Implied private and social return on capital
Conclusion
A key implication of our results is that accounting for potentially numerous indirect effects can be essential for evaluating firm policies. In our setting, a high social return implies that the programme generated large welfare gains. However, only accounting for the direct and indirect effects on firms while ignoring the effect on consumers would imply smaller and insignificant gains. A second implication is that interventions such as loan programmes can have large distributional effects, creating both winners and losers. This raises the policy question of whether the losers need to be compensated in some way.
Editors’ note: This article is based on this PEDL research.
References
Banerjee, A and E Duflo (2014), “Do Firms Want to Borrow More? Testing Credit Constraints Using a Directed Lending Program”, Review of Economic Studies 81: 572-607.
Cai, J and A Szeidl (2022), "Indirect Effects of Access to Finance", NBER Working Paper No. 29813.
De Mel, A, D McKenzie and C Woodruff (2008), “Returns to Capital in Microenterprises: Evidence from a Field Experiment”, The Quarterly Journal of Economics 123(4): 1329-1372.
McKenzie, D and S Puerto (2021), “Growing Markets through Business Training for Female En- trepreneurs: A Market-Level Randomized Experiment in Kenya”, American Economic Journal: Applied Economics 13(2): 297-332.
Rotemberg, M (2019), “Equilibrium Effects of Firm Subsidies”, American Economic Review 109(10): 3475–3513.