


Examining the expansion of Jakarta’s bus system shows how simple improvements in public transport service quality can boost usage
LMIC cities are moving towards centralised operations of public transport
Editor’s note: For more evidence on improving transport infrastructure, check out our new VoxDevLit on Land Transport Infrastructure.
Providing effective urban transportation is central to functioning and productive cities (Bryan et al. 2020, Bajpai 2018) and remains one of the key policy challenges in large cities in low- and middle-income countries (LMICs) today.
The status quo for many developing cities is that urban transport is provided by the private market in the form of mini-buses or bus taxis. These complex systems are still poorly understood by economists. They may offer advantages in terms of organically providing service where the demand for travel exists, yet researchers have also shown that private provision is rife with inefficiencies due to the specific form of competition, and externalities due to unsafe driving and agency problems (Johnson et al. 2005, Conwell 2023, Habyarimana and Jack 2015, Lane et al. 2022, Kelley et al. 2023).
Against this backdrop, many cities are increasingly centralising operations of public transport systems, getting involved in planning and operations directly. For example, worldwide, the number of cities with a Bus Rapid Transit (BRT) system grew from 39 to over 180 in the last 20 years (BRTData.org 2023).
The stakes for whether cities design effective public transport networks are high, as these systems are costly and take significant time and political capital to build. Sub-par networks can have low ridership. In extreme cases, these systems may even worsen urban mobility, for example, if they increase traffic congestion (Gaduh et al. 2022, Gaduh et al. 2019).
Designing effective public transport networks depends on complex demand patterns
How should cities design these systems given the resources they have available? This is a difficult problem, for three reasons. First, it is often quite difficult to measure demand, especially in large, sprawling cities in LMICs. Precise and updated data sources on mobility patterns are scarce, especially at fine levels of geographic granularity.
Second, demand for public transport depends not only on how many people want to travel but also on how much commuters care about different measures of service quality such as wait times, travel time, and whether transfers are necessary for getting from point A to point B.
Third, the problem of network design depends in a complicated way on demand over all pairs of locations in the city. Each route serves multiple origin-destination pairs, and different routes may either complement each other – for example, overlapping routes effectively decrease wait times – or may serve as substitutes for each other, for example in the context of different routes serving nearby areas.
The space of all possible route configurations is particularly perplexing in the case of bus routes, which are more flexible and hence configurable compared to rail options. While rail systems such as the Delhi metro or the recently launched Lagos metro get significant attention given their cost and scale, in many countries most public transit ridership happens on buses.
Learning from TransJakarta’s expansion
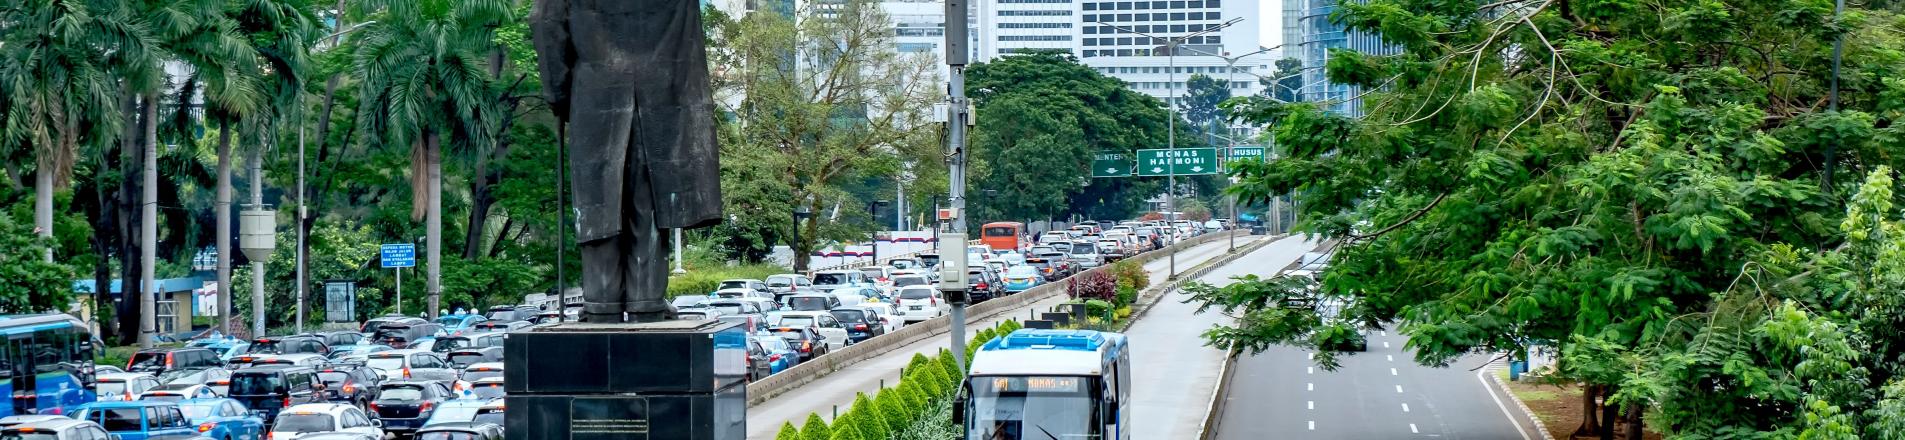
TransJakarta, the bus system serving greater Jakarta, Indonesia, undertook a major expansion of its network over the past decade. In particular, it tripled its routes and doubled the number of buses in operation between January 2016 and February 2020.
In a recent study (Kreindler et al. 2023), we worked together with TransJakarta to examine the effects of this expansion on ridership and aggregate trip flows across its 120-mile network.
The TransJakarta system integrates Bus Rapid Transit (BRT) lines that operate on dedicated bus lanes with designated stations, and non-BRT routes that run on some city streets as well as on BRT corridors, making stops at BRT stations.
We study the impact of introducing new routes on two main outcome measures. First, we worked with TransJakarta to construct bus ridership flows between every pair of stations over time, using over half a billion smartcard transactions in their administrative data. Although TransJakarta had been collecting this data, they previously had not analysed ridership flows because of technical constraints. We use this data to measure how bus ridership within the TransJakarta system is affected.
Second, to measure aggregate trip flows, we use two years of anonymised smartphone location data covering the larger Jakarta area.
We measure the impact of three types of changes induced by new route launches. First, we find a 16% increase in ridership when two locations went from being connected using transfers to being directly connected, in those cases when the new route had a similar travel time as previous connections (Figure 1). Second, the effect on ridership was larger, at 27%, when the new direct route was also faster than the existing transfer connections (Figure 1). Third, ridership increased 9% when a new direct route launch increased the frequency between two locations that were already directly connected (Figure 2).
The third type of event (Figure 2) implies that a 10% decrease in wait times leads to a 2.9% increase in ridership on BRT routes, and a 10.5% increase for non-BRT routes. These results are not due to TransJakarta passengers being displaced from existing routes – when we aggregate origin and destination locations at larger scales, our results remain stable.
Figure 1: Impact of events 1 and 2: first direct route with/without lower travel time on the bus (BRT)
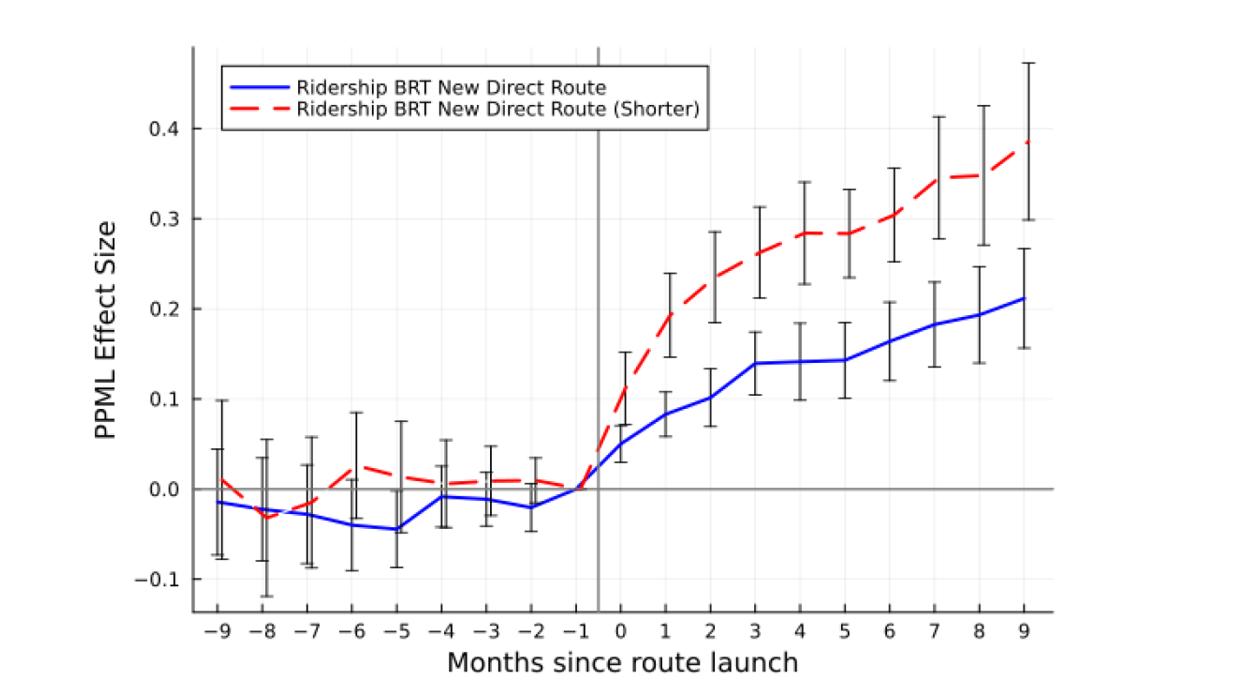
Note: The Y axis measures impact on ridership on a log scale
Figure 2: Impact of event 3: additional direct route increases arrival rate of buses (BRT)
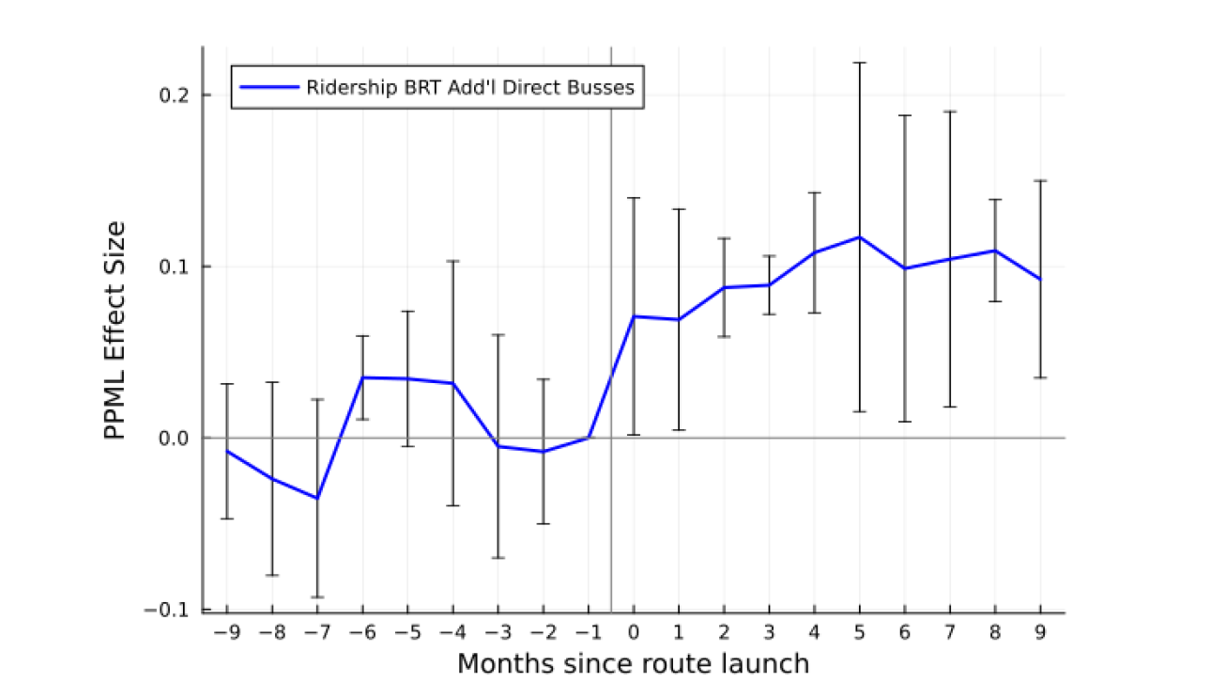
Note: The Y axis measures impact on ridership on a log scale
Similar types of changes for non-BRT bus routes have larger proportional effects, yet similar effects in levels, reflecting lower baseline ridership on non-BRT routes (Figure 3).
Looking across all modes of transportation in the city–TransJakarta and otherwise–we did not find aggregate trip volume increases after any of these events. Taken together, these results imply that TransJakarta increased its mode share relative to other, predominantly private, transport options.
Figure 3: Ridership impact of new routes for BRT and non-BRT routes
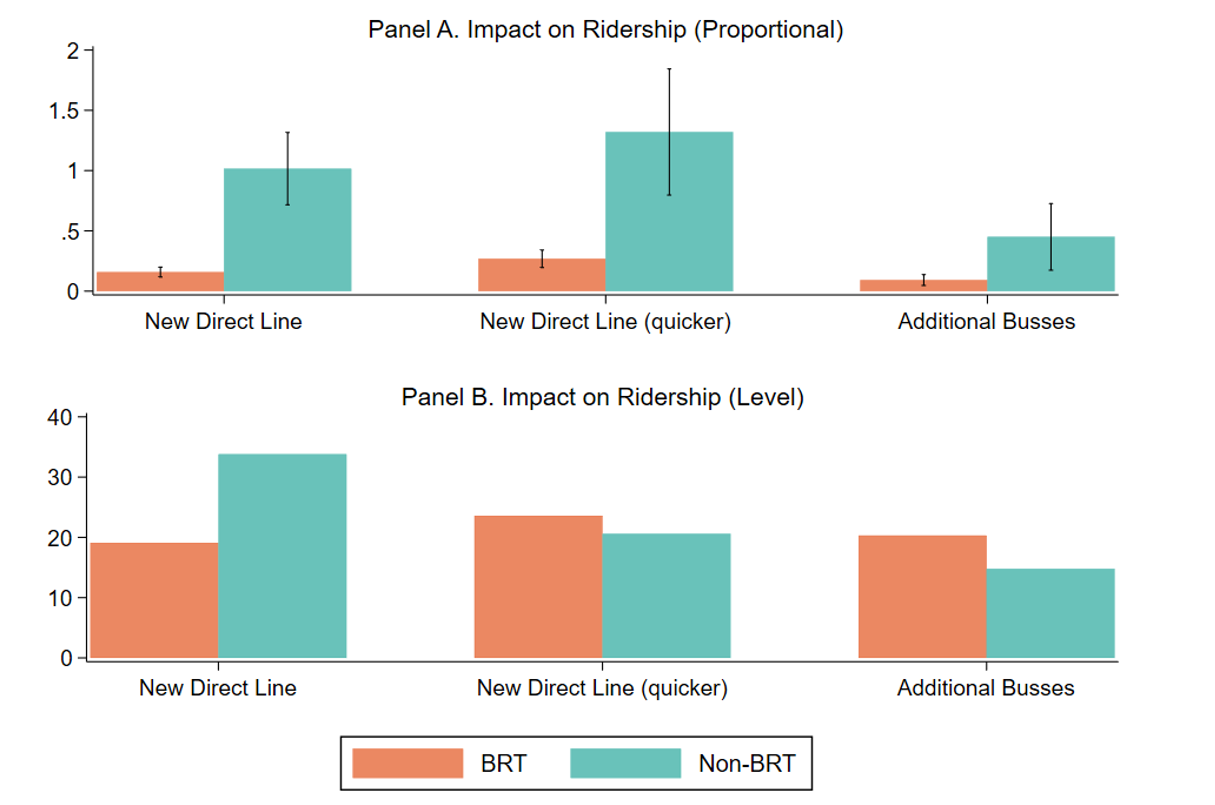
Note: The Y axis measures impact on ridership on a log scale in panel A and in levels (ridership per week at the origin-destination level) in panel B
To interpret these empirical findings, we develop a model of demand for public transportation and estimate it by matching the impacts on bus ridership.
We have two key results on commuter preferences in Jakarta. First, commuters are 2.4-4.2 times more sensitive to wait time for the bus than time spent on the bus. This may capture the uncertainty in wait times and differences in the experience of waiting compared to riding the bus. This effect is stronger for waiting for non-BRT buses than for waiting for BRT buses. Second, the pure transfer penalty, which captures dislike for transfers above and beyond travel time and wait time, is small and not statistically significantly different from zero. (Transfers may still be significantly costlier than direct connections, for example because they involve waiting for buses twice.)
Network design implications
Finally, we use the estimated demand model to compare the post-expansion TransJakarta network with networks that deliver high levels of total rider welfare in our model. To do so, we develop a theoretical and computational framework for describing the characteristics of such networks.
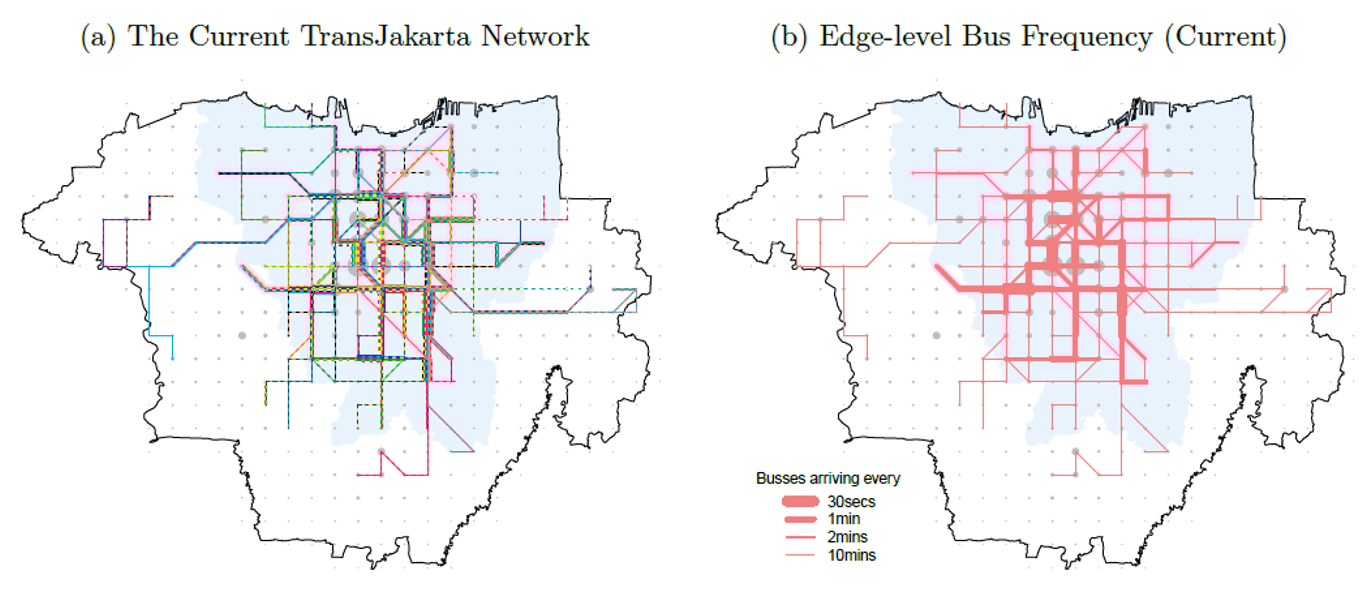
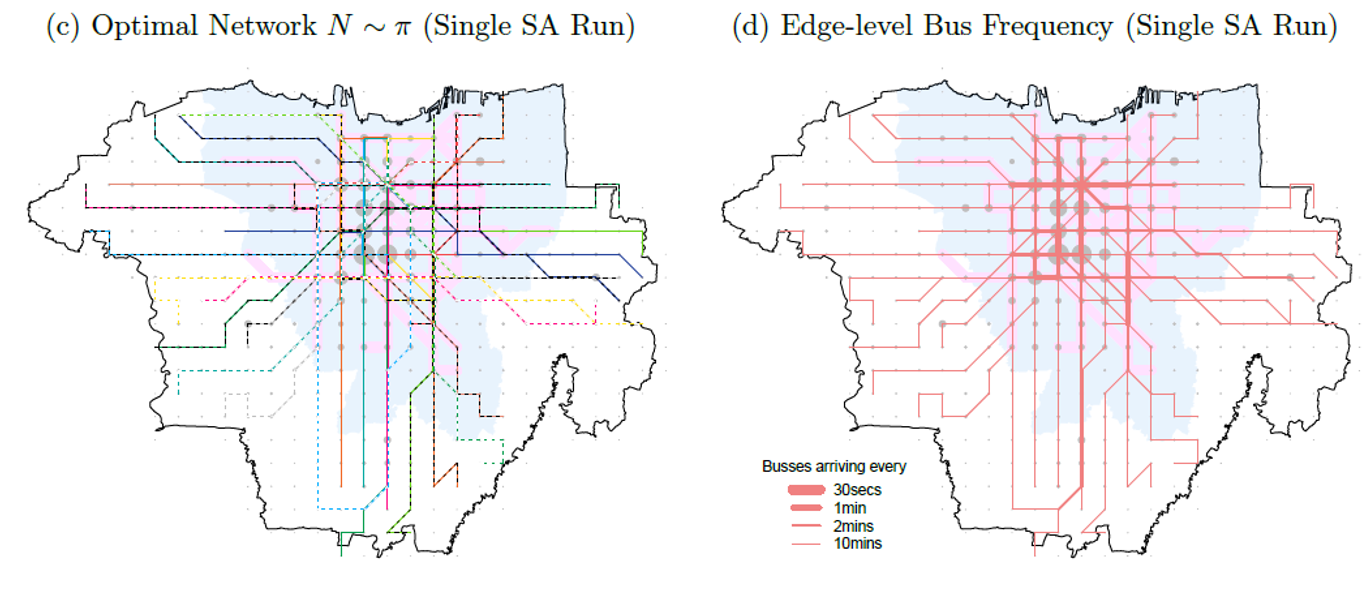
The current network is characterised by a concentration on the city’s urban core, with relatively few bus routes connecting to the city’s outskirts. In contrast, the optimal network is less dense and extends beyond the center of the city, connecting 57% more locations. In the optimal network, 39% of all pairs of locations in the city are connected by either a direct or transfer bus connection; in the current network, only 12% are. Despite the high value that commuters place on wait time, these results suggest that system ridership would have been greater if the network had focused on broad expansion rather than intensifying service in the urban core.
We estimate that the benefit of shifting to the optimal network (measured in terms of equivalent variation) would be the same as shaving 23 minutes off the travel time for each bus user in the current network for every trip they make.
Figure 4: Current TransJakarta network and optimal network example
Discussion
Efficient public transportation is key to fostering thriving, productive cities, but figuring out what an efficient system should look like and delivering services accordingly is challenging, particularly in large cities in LMICs, where urban transit systems often originate from a patchwork of private providers. Many of these developing megacities are now in the process of centralising their fragmented urban transport systems, which offers the opportunity to think holistically about optimal network design for entire cities. As a byproduct, centralisation also frequently leads to the collection of vast amounts of administrative data from tap cards, bus GPS, etc. that, when leveraged effectively, can provide powerful empirical insights for city-wide network design. For example, by analysing the TransJakarta bus network expansion in Jakarta, Indonesia, we learned practical takeaways such as: decreasing wait times on BRT routes has a larger impact on ridership than for non-BRT routes; that passengers are more averse to waiting for a bus than spending time on a bus; and that the optimal network for Jakarta would be more broadly dispersed than the current network. This case study demonstrates the potential role of data-driven urban transport network design in planning thriving cities around the world.
Our project also highlights the benefits of close collaboration between researchers and public transport providers. Our collaboration with TransJakarta began in 2018 as part of their initiatives to improve service. Through discussions with TransJakarta leadership, bus dispatchers, and IT personnel, we were able to collaboratively develop a study that would yield both generalisable insights and actionable information for TransJakarta operations, making use of TransJakarta’s existing data systems. As the project progressed and our team met with TransJakarta on a near weekly basis, our work together shifted to coordinating data transfers, technical skills sharing sessions to explain our tools and methods for leveraging that data, and discussions of results as they became available. This collaboration had real impacts for TransJakarta. In 2022, recognising the untapped potential of its own data, TransJakarta implemented a new policy and improved infrastructure to better enforce how passengers use fare cards to tap in and tap out of buses, resulting in a 40% increase in the passenger tap out rate. Informed by results of the study, TransJakarta leadership has expressed support for providing more reliable wait time information to passengers and continuing the expansion of its network. While projects like this take time and require intensive collaboration, they can have important impacts for transport policy and operations on the ground.
This material is based upon work supported by the National Science Foundation under Grant No. 2049784, by the Australian Government, the International Growth Centre, the Harvard Asia Center, and the Harvard Data Science Initiative. Any opinions, findings, and conclusions or recommendations expressed in this material are those of the author(s) and do not necessarily reflect the views of the National Science Foundation.
References
Bajpai, J (2018), “An Agenda for Urban Access.” Blog post. Infrastructure & Urbanisation. February 12, 2018. https://voxdev.org/topic/infrastructure-urbanisation/agenda-urban-access.
BRTData.org (2023), “PANORAMA PER YEAR.” https://brtdata.org/panorama/year/.
Bryan, G, E Glaeser, and N Tsivanidis (2020), “Cities in the Developing World.” Annual Review of Economics 12(1): 273–97. https://doi.org/10.1146/annurev-economics-080218-030303.
Conwell, L (2023), “Subways or Minibuses? Privatized Provision of Public Transit by Lucas Conwell.” SSRN. https://papers.ssrn.com/sol3/papers.cfm?abstract_id=4489658.
Gaduh, A, T Gracner, and A Rothenberg (2019), “‘Second-Best’ Bus Rapid Transit and Traffic Congestion in Developing Countries: Lessons from TransJakarta.” Infrastructure & Urbanisation. https://voxdev.org/topic/infrastructure-urbanisation/second-best-bus-rapid-transit-and-traffic-congestion-developing-countries-lessons-transjakarta.
Gaduh, A, T Gračner, and A D Rothenberg (2022), “Life in the Slow Lane: Unintended Consequences of Public Transit in Jakarta.” Journal of Urban Economics 128: 103411. https://doi.org/10.1016/j.jue.2021.103411.
Habyarimana, J, and W Jack (2015), “Results of a Large-Scale Randomized Behavior Change Intervention on Road Safety in Kenya.” Proceedings of the National Academy of Sciences 112(34): E4661–70. https://doi.org/10.1073/pnas.1422009112.
Johnson, R M, D H Reiley, and J Carlos Munoz. 2005. “‘The War for the Fare’: How Driver Compensation Affects Bus System Performance.” Working Paper. Working Paper Series. National Bureau of Economic Research. https://doi.org/10.3386/w11744.
Kelley, E, G Lane, and D Schonholzer (2023), “How Providing Information Can Improve Safety: Evidence from Kenya’s Informal Public Transit Sector.” Blog post. https://voxdev.org/topic/infrastructure-urbanisation/how-providing-information-can-improve-safety-evidence-kenya-s-informal-public-transit-sector.
Kreindler G, A Gaduh, T Graff, R Hanna and B A Olken (2023), "Optimal Public Transportation Networks: Evidence from the World's Largest Bus Rapid Transit System in Jakarta," NBER Working Paper 31369 https://www.nber.org/papers/w31369
Lane, G, D Schonholzer, and E Kelley (2022), “Information and Strategy in Lemon Markets: Improving Safety in Informal Transit.” Text. PEDL. https://pedl.cepr.org/publications/information-and-strategy-lemon-markets-improving-safety-informal-transit