


Vietnam’s Special Economic Zones are not just attracting investment—they are creating better, more formal jobs, with women in rural areas benefiting most.
Editor’s note: For a broader synthesis of themes covered in this article, check out our VoxDevLit on Foreign Direct Investment.
The policy puzzle: Are Special Economic Zones a silver bullet for development?
Special Economic Zones (SEZs) are one of the most popular industrial policy tools for developing countries seeking to attract (foreign) investment, create ‘productive’ jobs, and stimulate growth. Globally, over 5,400 SEZs have been established across 147 countries, representing a massive public and private investment in place-based development (UNCTAD 2019). Yet, despite their proliferation, the central policy question of whether they achieve these objectives remains contentious, as the evidence is mixed.
China’s pioneering Special Economic Zone (SEZ) programme is widely credited as one powerful driver of its economic success, attracting significant foreign direct investment (FDI) and creating millions of jobs, particularly in the manufacturing sector (Lu et al. 2019, Wang 2013, Zhao 2023). Recent evidence from Africa indicates that households in close proximity to SEZs experience significant improvements in economic well-being, as evidenced by better access to utilities, improved housing, increased consumption of durable goods, and enhanced educational outcomes (Abagna et al. 2025). Similarly, research on India presents a more ambiguous picture: studies find moderate productivity and employment effects (Hyun and Ravi 2018) but no positive socio-economic spillovers (Alkon 2018, Görg and Mulyukova 2024, Rothenberg et al. 2025). Furthermore, evidence from Cambodia indicates that, while SEZs do increase employment, this is predominantly in the form of informal non-manufacturing activities without positive effects on wages (Brussevich 2023).
Vietnam offers another compelling case study. Over the past two decades, it has achieved spectacular economic growth and poverty reduction, driven by its deep integration into global value chains (GVCs) and its success in promoting trade and attracting FDI (McCaig et al. 2022, McCaig and Pavcnik 2018, Baccini et al. 2019). A cornerstone of this strategy has been the establishment of over 300 SEZs, which have channelled much of this trade and foreign investment. This raises crucial questions: How have Vietnam’s SEZs contributed to its economic transformation, and what lessons can be learned from its experience? Our recent research (Tafese, Lay, and Tran 2025) sheds new light on the impact of Vietnam’s ambitious SEZ programme on local labour markets by combining georeferenced SEZ data with detailed micro-level employment data.
Measuring Special Economic Zones from space
One of the major challenges in evaluating SEZs is accurately measuring their level of economic activity. Previous research has mostly relied on a simple binary indicator: a location either has an approved SEZ or it does not. This approach is overly simplistic, as it treats a newly designated, empty plot of land in the same way as a large, well-established industrial park full of factories and workers.
To overcome this limitation, we have produced novel data on the intensity of SEZ activity over time. Using historical satellite imagery from Google Earth, we manually traced the expansion of the physical footprint—the factories, warehouses, and other industrial structures—of 372 SEZs across Vietnam, year by year, between 2009 and 2019. This allowed us to create a continuous measure of the ‘built-up area’ of each SEZ, capturing its transformation from empty fields to bustling industrial zones. Figure 2 illustrates the expansion of the SEZ Van Trung and our mapping process, which involves manually drawing polygons around its sheds and other built-up areas. Although Van Trung was approved in 2009, sheds first appear in the January 2014 image—eight of them, to be exact—covering an area of 4.7 hectares (ha). In the most recent image, dated December 2020, Van Trung's built-up area had increased to 256.8 ha.
Figure 1: The expansion of SEZ Van Trung
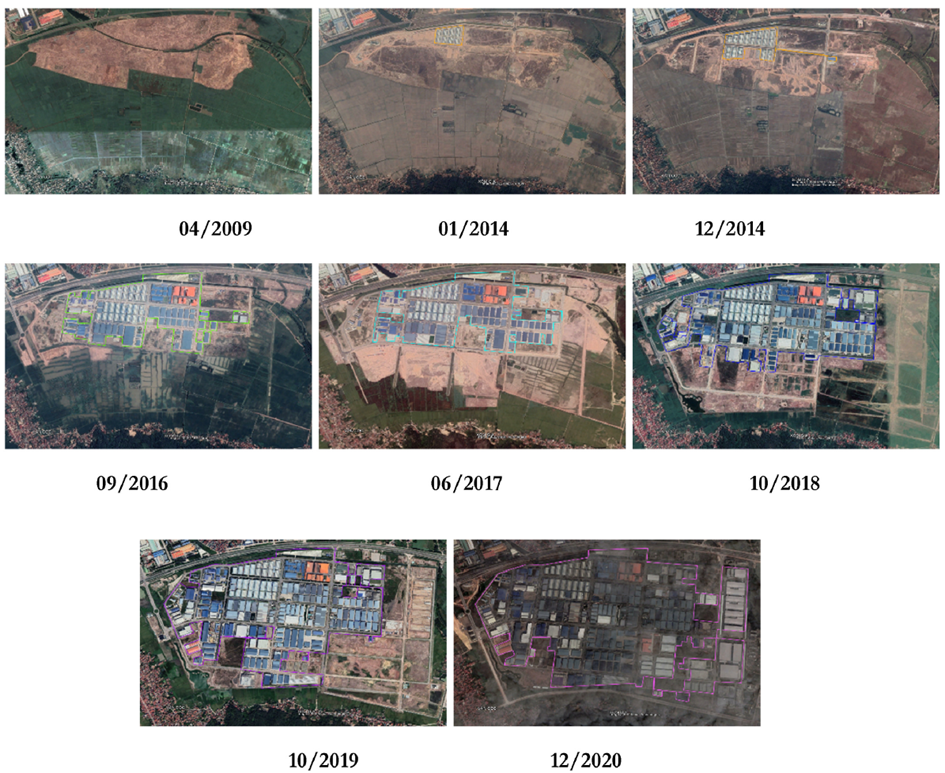
Notes: The satellite imagery is taken from Google Earth Pro.
Recent research has shown that changes in the physical area occupied by factories are in fact a strong predictor of their economic output (Bilicka and Seidel 2022). Our continuous SEZ exposure measure therefore improves significantly on previous methods of measuring SEZ activity.
Studying the impact of Special Economic Zones
Our empirical analysis is conducted at the district-year level. We obtain a continuous treatment variable of SEZ exposure by aggregating the built-up area of all SEZs in the same district and year. The outcome variables—sector of employment, wages, and working conditions—are constructed from two nationally representative, fine-grained individual-level datasets.
We estimate the impact of SEZ exposure on local labour markets in a difference-in-differences design with continuous treatment. We make sure that we compare treated and non-treated districts that are very similar in terms of their pre-treatment characteristics in 2009.
How Special Economic Zones are driving inclusive structural transformation in Vietnam
Our primary finding is that the expansion of SEZs has been a powerful driver of structural change in Vietnam. As these zones grow, they pull workers out of own-account and family work in agriculture into wage work in manufacturing. For every 100 hectares of built-up SEZ area—roughly the size of an average zone in 2019—we estimate that the proportion of the district workforce employed in agriculture would decrease by 3.8 percentage points (pp), while the proportion employed in manufacturing would increase by 3.7 pp. This increase in manufacturing employment is economically substantial, representing a 46% increase on the 2009 baseline. Most of this new employment is in foreign-owned firms, concentrated in export-oriented manufacturing sub-sectors such as textiles, leather, and electronics—hallmarks of Vietnam’s GVC integration.
Notably, the shift in employment from agriculture to manufacturing is almost twice as large for women as for men in treated districts; for every increase of 100 ha in SEZ built-up area, female manufacturing employment increases by 4.5 pp, compared to 2.7 pp for males (Figure 2, top row). Moreover, the documented shift from agriculture to manufacturing is almost entirely driven by the effect on individuals living in rural areas; the effect on individuals living in urban locations is not statistically significant at the 5% level (Figure 2, bottom row).
Figure 2: The Impact of SEZ exposure by gender (top row) and location (bottom row)
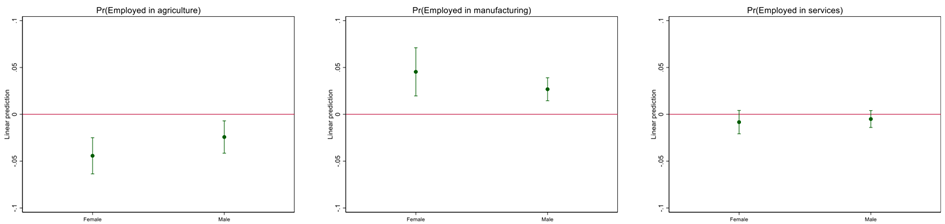
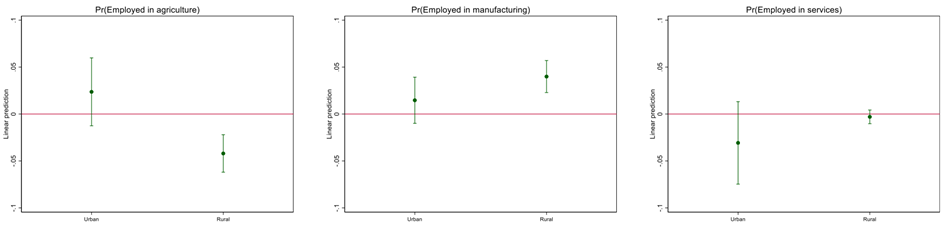
Notes: The green dots indicate the coefficient estimates representing the effect of a 100 ha increase in built-up area and the green vertical lines indicate 95% confidence intervals.
At the same time, our research suggests that the economic benefits of SEZs in Vietnam extend beyond the factory gates. Benefits spill over into the local economy, resulting in higher earnings for workers in private domestic firms and local household businesses, in both agriculture and services. We also document significant improvements in working conditions, as measured by workers’ labour contracts and social insurance registration status. Once again, these positive effects are mostly driven by women.
Lessons from Vietnam: A model for success?
Our research paints a remarkably positive picture: Vietnam’s SEZs have successfully driven structural transformation, creating better, more formal jobs, and raising local earnings and working conditions through positive spillovers. These benefits have been delivered inclusively, particularly empowering women in rural areas.
However, it is important to recognise that SEZs are not a panacea, and that their success in Vietnam does not guarantee success elsewhere. They do not operate in isolation and their effectiveness was enabled by a broader ‘development bargain’ (Dercon 2022)—a commitment by the country’s elites to a range of complementary policies that created a fertile ground for SEZs to thrive. Key among these were (i) the creation of a conducive investment climate, facilitated by an open trade and investment regime and complemented by domestic economic policies; (ii) decentralisation and administrative capacity (and commitment) at various levels of government, especially at the provincial level; and (iii) and an education system capable of equipping workers with the skills needed in the country’s growing manufacturing sectors.
The evidence presented adds to the debate by showing how SEZs are the physical locations where structural change and growth with inclusive characteristics—favouring women in rural areas—are taking place. In our view, they can form an important element—albeit only one—of an outward-oriented development strategy. A fruitful area for future research would be to examine how the nuances and implementation details of a particular SEZ programme, as well as complementary policies and other contextual factors, influence the effectiveness of SEZs, explaining why they are successful in some places but not in others.
References
Abagna MA, C Hornok, and A Mulyukova (2025), “Place-based policies and household wealth in Africa,” Journal of Development Economics 176: 103482.
Alkon M (2018), “Do special economic zones induce developmental spillovers? Evidence from India’s states,” World Development 107: 396–409.
Bilicka K, and A Seidel (2022), “Measuring firm activity from outer space,” Unpublished manuscript.
Baccini L, G Impullitti, and EJ Malesky (2019), “Globalization and state capitalism: Assessing Vietnam’s accession to the WTO,” Journal of International Economics 119: 75–92.
Brussevich M (2023), “The socioeconomic impact of special economic zones: Evidence from Cambodia,” The World Economy 47(1): 362–387.
Dercon S (2022), “Gambling on development: Why some countries win and others lose,” Hurst Publishers.
Görg H, and A Mulyukova (2024), “Place-based policies and firm performance: Evidence from special economic zones in India,” European Economic Review 165: 104752.
Lay J, and T Tafese (2020), “Promoting private investment to create jobs: A review of the evidence,” Unpublished manuscript.
Hyun Y, and S Ravi (2018), “Place-based development: Evidence from special economic zones in India,” Unpublished manuscript.
Lu Y, J Wang, and L Zhu (2019), “Place-based policies, creation, and agglomeration economies: Evidence from China’s economic zone program,” American Economic Journal: Economic Policy 11(3): 325–360.
McCaig B, and N Pavcnik (2018), “Export markets and labor allocation in a low-income country,” American Economic Review 108(7): 1899–1941.
McCaig B, N Pavcnik, and WF Wong (2022), “FDI inflows and domestic firms: Adjustments to new export opportunities,” Unpublished manuscript.
Rothenberg, A D, Y Wang, and A Chari (2025), “When regional policies fail: An evaluation of Indonesia’s integrated economic development zones,” Journal of Development Economics, 176: 103503.
Tafese T, J Lay, and V Tran (2025), “From fields to factories: Special economic zones, foreign direct investment, and labour markets in Vietnam,” Journal of Development Economics 174: 103467.
UNCTAD (2019), “World investment report 2019: Special economic zones,” United Nations Conference on Trade and Development.
Wang J (2013), “The economic impact of special economic zones: Evidence from Chinese municipalities,” Journal of Development Economics 101: 133–147.
Zhao C, and X Qu (2023), “Place-based policies, rural employment, and intra-household resources allocation: Evidence from China’s economic zones,” Journal of Development Economics 167: 103210.