


Insights from a year of smartphone app data suggest high levels of spatial mobility
A body of empirical work points towards large gaps in nominal wages, productivity, and living standards across sectors and locations (Young 2013, Gollin et al. 2014, Herrendorf and Schoellman 2018, Gollin et al. 2021). The apparent magnitude and persistence of these gaps suggests that there are frictions limiting the movement of people and that these frictions sustain a spatial equilibrium. In our study (Blanchard et al. 2021), we use novel data in an effort to characterise the types of frictions that might shape the equilibrium.
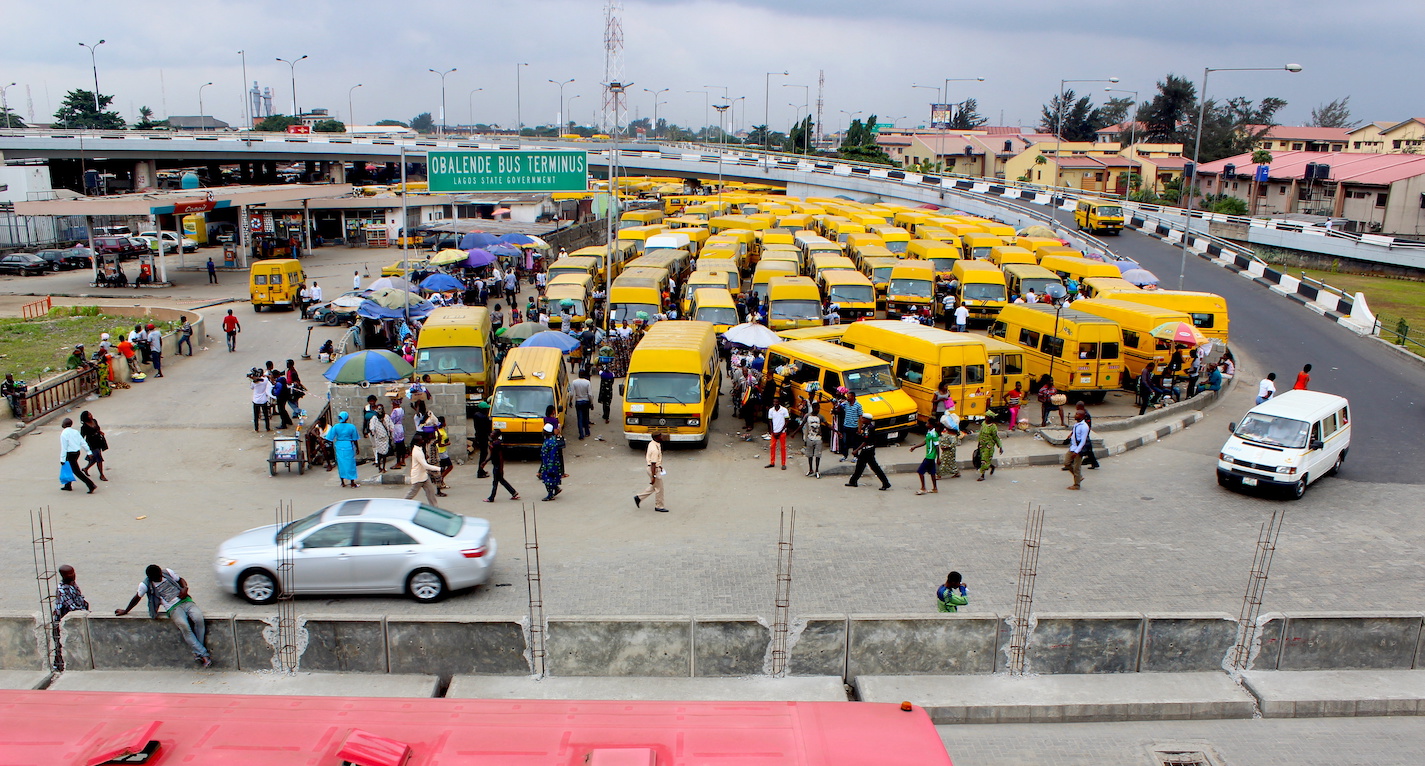
We focus on high-frequency spatial mobility, i.e. trips taken between within-country locations, excluding daily commuting. The ubiquity of this type of mobility can be observed on the ground. Anyone who has spent time at a bus station in Accra or Arusha will appreciate that people travel for a variety of reasons – for work, for family and social occasions, and for educational or religious purposes, to list a few.
Studying this kind of within-country mobility is potentially informative about the nature of spatial frictions. One potential explanation for persistent spatial and sectoral gaps is that mobility is simply infeasible or unaffordable for people - if so, we should see relatively little travel between locations. Alternatively, people in disadvantageous locations might simply be unaware of opportunities elsewhere - perhaps because so few people move that there is little scope to hear about these opportunities. Still another alternative might be the existence of deeper frictions associated with migration or sectoral changes. By studying movement patterns of individuals within countries, we shed some light on the types of frictions that might plausibly be responsible for persistent sectoral and spatial gaps.
Our work connects with a growing literature that highlights frictions in the movement of goods within countries (Donaldson 2018, Atkin and Donaldson 2015, Grant and Startz 2022), documents the interactions between firms (Bernard et al. 2019, Demir et al. 2021), and studies the nature of information frictions (Startz 2016).
To date, within-country human mobility has been difficult to quantify with available datasets. Censuses or household surveys typically only record migration decisions, if they address mobility at all. Migration choices represent longer-term and more permanent movement of people. Because migrants are not easily tracked in panel datasets, there is not much detail available to understand migration choices – even in the context of sub-Saharan Africa, where rural-urban migration is relatively common. Available human mobility data often lack detail on origins and destinations of trips. Travel surveys contain detailed information on commuting, but often miss non-work trips - and very few such surveys are available for low-income countries.
Using smartphone app data for studying high-frequency mobility
We develop a new approach to measuring high-frequency mobility by using newly available, fine-grained, but anonymised location data from smartphones. This data allows us to study short-term mobility at a national scale over an entire year in three large African countries: Nigeria, Kenya, and Tanzania. Each observation in our data is a ‘ping’ - an instance when a phone connects to the internet to use a certain app (e.g. social media, navigation, information). For each such ping, we observe a device identifier, a GPS location, and a precise time stamp. This type of data has been used extensively in the US, for example, to study experienced segregation, or the effectiveness of social distancing (Athey et al. 2021, Mongey et al. 2021).
We start by assigning a home location to each device, according to the 0.01-degree cell (≈1.1km2) where the device is seen most often between 7pm and 7am, with some restrictions to ensure high confidence in the assignment. We mainly think of a device as an individual, but also discuss implications of smartphone-sharing or ownership of multiple smartphones for our results.
We then use the fact that devices are seen at different locations within countries to characterise movements of users. For example, we can ask: How frequent are trips and what distances do they cover? What patterns of mobility do we observe across cities? What do the mobility patterns suggest about flows of information between rural and urban areas?
Before proceeding with the analysis, we pay particular attention to the fact that smartphone users are not representative of the population in our setting. We use a variety of data sources to characterise the individuals who are represented by our data. Although we are limited in what we can observe directly, we are able to infer a number of attributes of our users by drawing on secondary data, and by studying the properties of their home locations. Our analysis suggests that, unsurprisingly, smartphone app users tend to be urban (although we do observe significant numbers with home locations in rural areas). They are also more educated, and richer than average. They represent a privileged segment of society, but do not appear hugely atypical, other than in the distribution across space. The home locations of our users are rather unremarkable when compared to similar locations that are observed in greater detail in nationally representative data. We argue that our population of users is informative about patterns of mobility in the broader population, although any extrapolation needs to be made with caution.
Mobility flows are substantial
We then develop a number of indicators to characterise high-frequency mobility related to frequency of movement, spatial extent, densities visited, and cities visited. Figure 1 shows the mobility behaviour of users residing in different population density deciles in Kenya. Users are seen more than 10km away from home on between 10% and 20% of the days they are observed.
Figure 1 The frequency and spatial extent of mobility by population density bin in Kenya
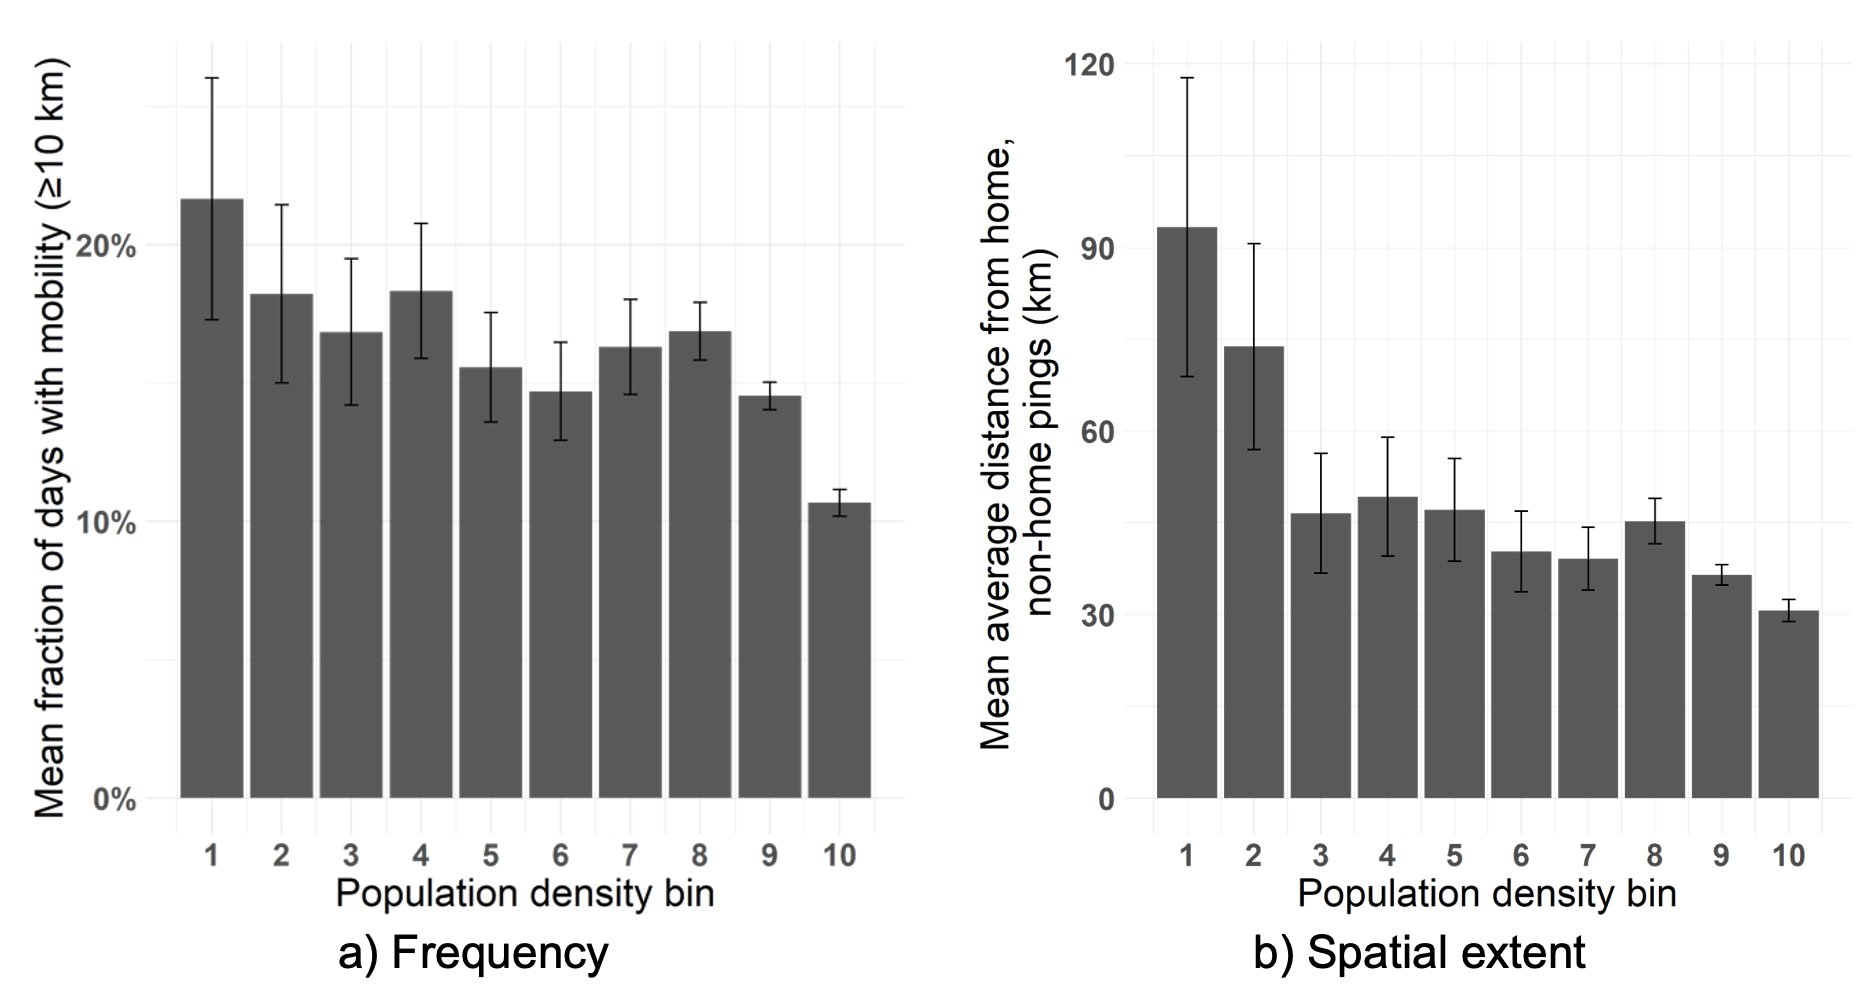
Note: Each user is assigned to a density bin based on the population density at the user’s home location. Population density bins correspond to density decile-bounded bins, i.e. each bin contains 10% of the population. Figure 1a) represents the average fraction of days with mobility beyond 10km across users. Figure 1b) gives the average across users of the mean distance away from home excluding home pings.
The average distance from home for non-home pings is 33.8km in Kenya. These overall patterns are very similar across the three study countries, with average distance of non-home pings of 31.8km in Tanzania and 45.5km in Nigeria. Figure 1 highlights that residents from more sparsely populated areas are more frequently away from home than city-centre residents, and venture further on average. Between 10% and 20% of the days when we observe our users, they are away from their home locations.
When looking at the destinations of our smartphone users, we see that the largest cities are magnets for mobility flows (see Figure 2). In each of the three countries, people travel to the largest cities from all origin locations, but secondary cities appear to draw visitors from local catchment areas and, to a limited extent, from other secondary cities.
Figure 2 Mobility flows to cities
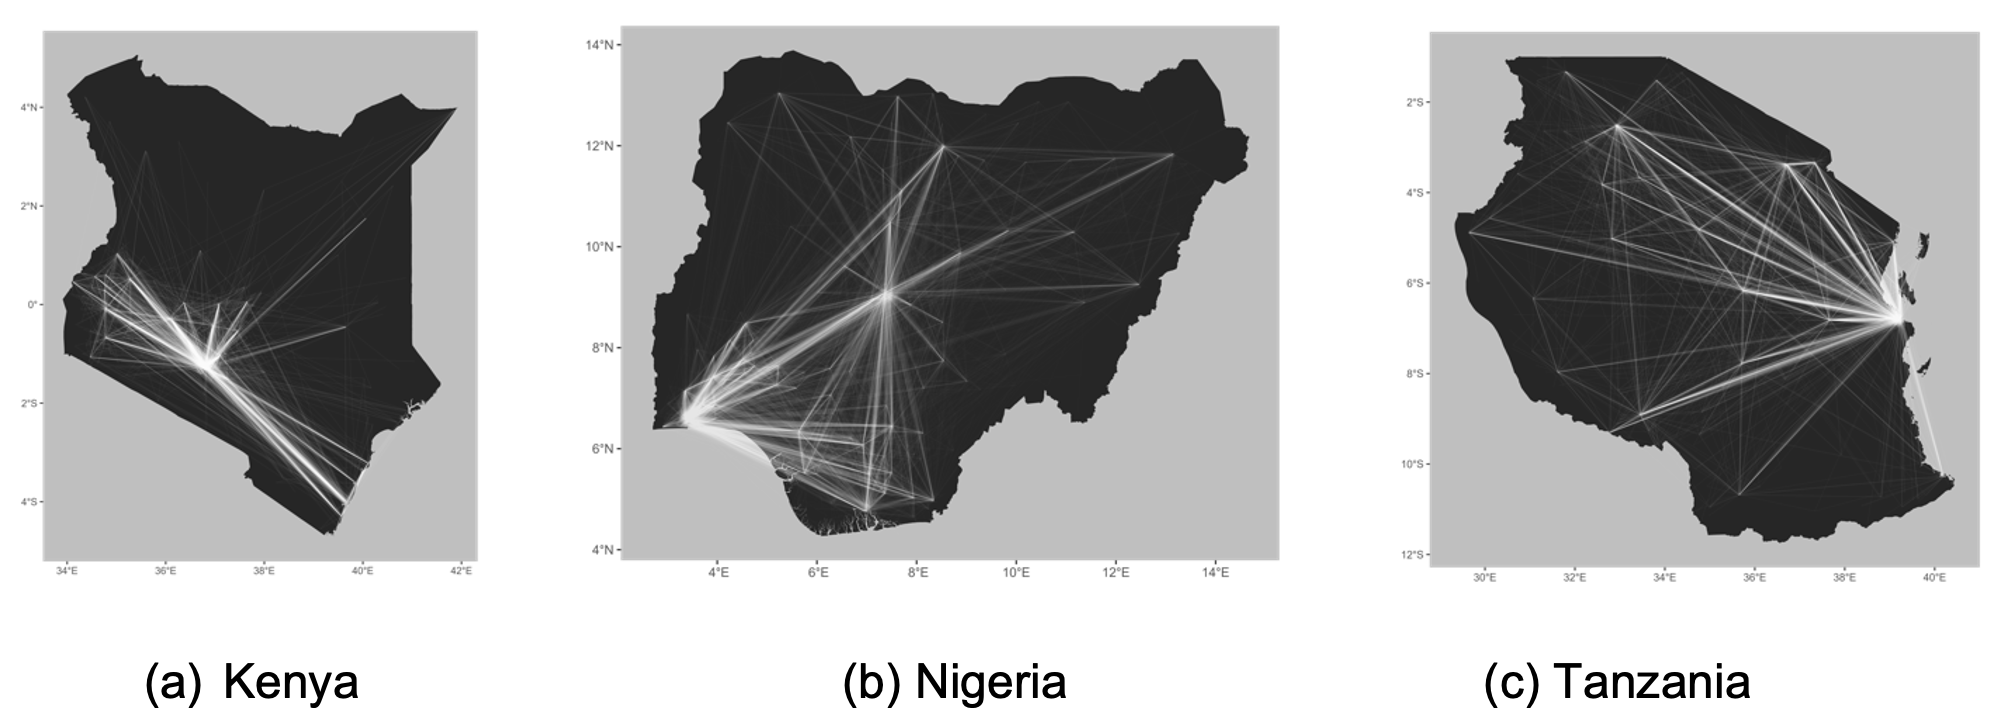
Note: The figure uses the brightness of lines to show the counts of distinct visits to any city of more than 50,000, from every spatial grid cell outside the city perimeter.
We next examine further patterns of interconnectedness. Figure 3 shows that a sizeable fraction of users across all densities are found to make visits to one or more cities, and residents in more remote locations are more likely to visit at least one city. We also find that users are making multiple visits to non-home cities.
Figure 3 Distribution of users according to the number of cities visited, by population density bin
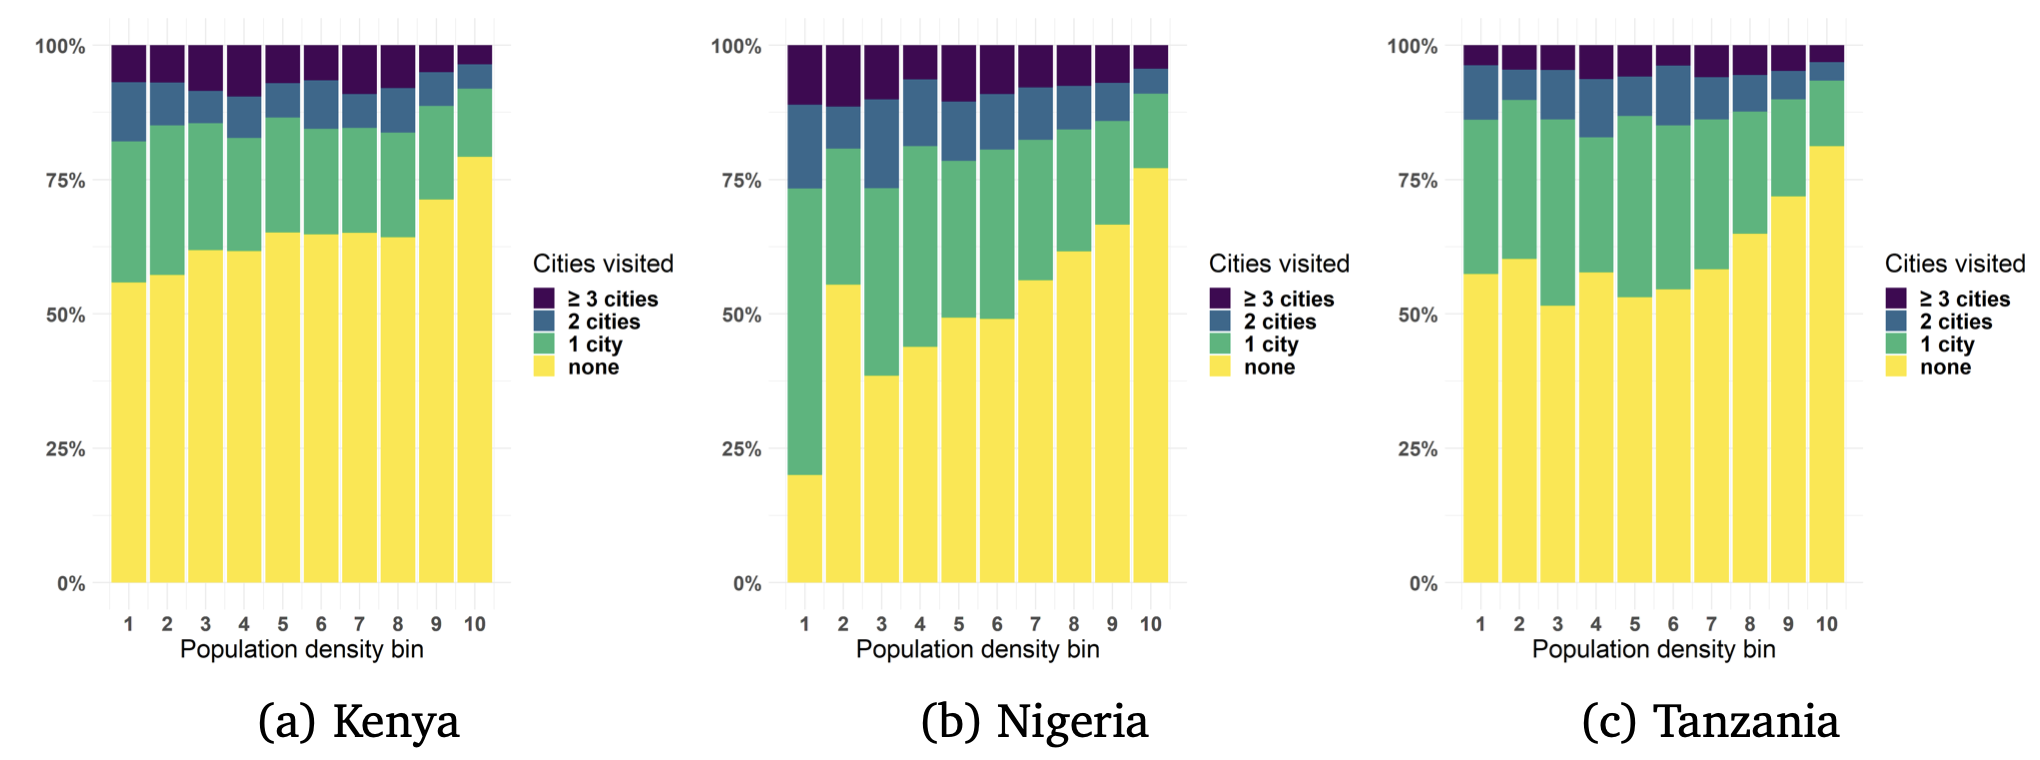
Note: This figure shows for each decile the distribution of users who are never seen in a city, those who visit exactly one city, those seen in two cities and those visiting three or more cities. These counts exclude the home city in the case of urban residents.
The spatial detail of our data also allows us to obtain insights into the precise locations that visitors to cities are seen at. For example, we find that pings by visitors to Lagos are spread out throughout the city. Figure 4 shows that individuals visit a vast array of amenities including shopping areas, entertainment locations, airports, public offices, and health facilities.
Figure 4 Destinations visited within cities: Lagos case study examples
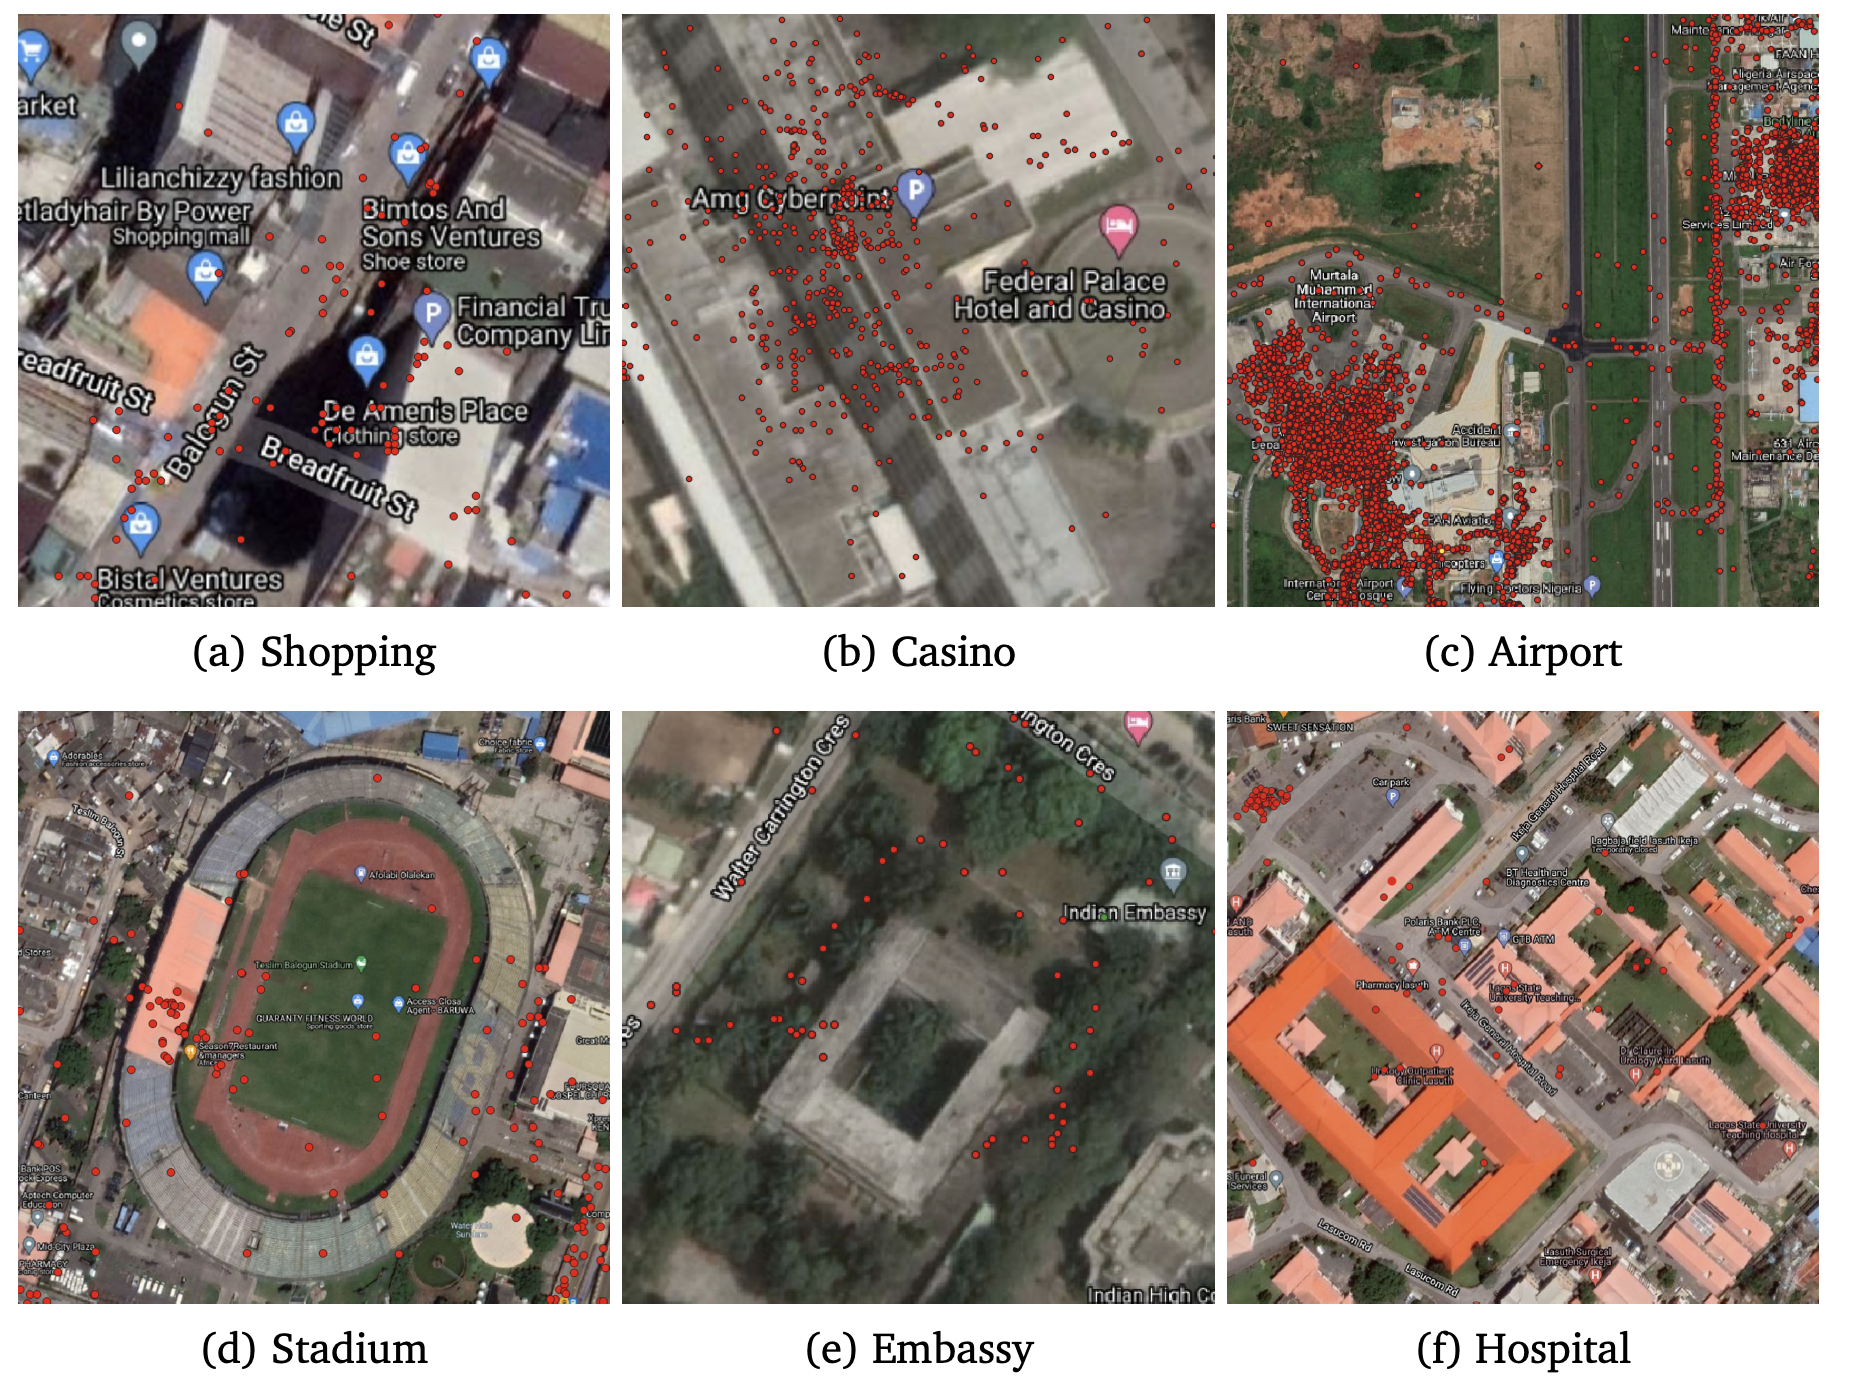
Note: This figure shows the distribution of pings of visitors to Lagos at specific selected locations.
With these descriptions in mind, we develop a theoretical framework in which individuals make mobility choices optimally and can consume amenities of different locations by making trips to these locations. The model delivers a number of testable predictions. For example, according to the model, the number of visits per capita from a smaller settlement is greater than the converse. Further, the model implies a gravity equation such that there is a relationship between distance to the destination and the duration of visits. The data are consistent with both of these predictions.
Conclusion
Our work highlights that populations in our three countries are substantially mobile across space, suggesting that people are finding ways to take advantage of spatial variation in amenities and opportunities, even without seasonal or permanent migration. Trips may function as substitutes for permanent migration - they presumably involve smaller fixed costs of relocation.
The substantial mobility we observe also suggests that variable costs of travel (e.g. bus tickets) are unlikely to be the main factors constraining the allocation of people across space – although that may not be true for poorer households. As people travel, information is likely to travel with them, which also casts doubt on the idea that information frictions sustain large spatial gaps in outcomes. Instead, our results point toward other types of frictions, such as loss of social connections, informal insurance, or claims to land or other possessions. Our study has obvious limitations in terms of the representativeness of the sample (especially in rural areas), and for extrapolating our findings beyond our three countries. More work is needed to understand patterns of mobility of the poorest in our three countries, and to understand mobility outside these study countries.
This article draws on research funded by STEG.
References
Athey, S, B Ferguson, M Gentzkow, and T Schmidt (2021), “Estimating experienced racial segregation in US cities using large-scale GPS data”, Proceedings of the National Academy of Sciences 118.
Atkin, D and D Donaldson (2015), “Who’s Getting Globalized? The Size And Implications of Intra-National Trade Costs”, NBER Working Paper 21439.
Bernard, A B, A Moxnes, and Y U Saito (2019), "Production networks, geography, and firm performance", Journal of Political Economy 127(2): 639-688.
Blanchard, P, D Gollin, and M Kirchberger (2021), “Perpetual Motion: Human Mobility and Spatial Frictions in Three African Countries”, CEPR Discussion Paper 16661.
Demir, B, A C Fieler, D Xu, and K K Yang (2021), “O-Ring Production Networks”, NBER Working Paper 28433.
Donaldson, D (2018), “Railroads of the Raj: Estimating the Impact of Transportation Infrastructure”, American Economic Review 108: 899-934.
Gollin, D, D Lagakos, and M E Waugh (2014), “The Agricultural Productivity Gap”, Quarterly Journal of Economics 129: 939–993.
Gollin, D, M Kirchberger, and D Lagakos (2021), “Do Urban Wage Premia Reflect Lower Amenities? Evidence from Africa”, Journal of Urban Economics 121: 103301.
Grant, M and M Startz (2022), “Cutting out the middleman: The structure of chains of intermediation”, NBER Working Paper 30109.
Herrendorf, B and T Schoellman (2018), “Wages, human capital, and barriers to structural transformation”, American Economic Journal: Macroeconomics 10: 1–23.
Mongey, S, L Pilossoph, and A Weinberg (2021), “Which workers bear the burden of social distancing?”, The Journal of Economic Inequality 19: 509–526.
Startz, M (2016), "The value of face-to-face: Search and contracting problems in Nigerian trade", Available at SSRN 3096685.
Young, A (2013), “Inequality, The Urban-Rural Gap, And Migration”, Quarterly Journal of Economics 128(4): 1727–1785.