


Data on prices and quantities of consumer packaged goods suggest that Mexican real consumption relative to the US is larger than previously estimated
Cross-country price indexes are crucial to comparing living standards between countries and to measuring global inequality. An accurate measurement of price indexes has proven difficult because of the lack of accurate data on the consumption patterns of different countries (Deaton and Heston 2010). Multiple revisions of the Penn World Table (PWT) tackled some of those challenges (Feenstra et al. 2015), but our understanding of the size of potential biases remains limited.
In our recent study (Argente et al. 2020), we construct unique data on prices and quantities for consumer packaged goods matched at the barcode-level across two countries: the US and Mexico. We identify heterogeneity in shopping behaviour, quality of products, and variety availability as important sources of bias in international price comparisons. We estimate that Mexican real consumption relative to the US is larger than previously estimated.
Indexes of prices across countries are a vital ingredient in estimates of standards of living and real output across countries. The most widely used price indexes are those by the International Comparison Program (ICP), which collects prices of more than a thousand specific products in multiple countries and then aggregates them into price indexes of 155 broad product categories (‘basic headings’) in each country.
There are three potential biases with the ICP's price indexes. First, instead of collecting prices directly from consumers, the ICP collects prices from retail stores chosen based on their total sales. However, if consumers are more likely to purchase more of the cheaply priced items in each store, prices should be sampled based on the volume of sales of items in a store. Second, products differ in quality across countries. The ICP addresses differences in quality by finding products that are ‘comparable’ across countries, but it is possible that the ICP matches lower quality items in one country with higher quality items in another country. Third, we know that goods available in one country are not available in other countries and the ICP makes no adjustment for potential differences in the availability of products across countries.
We use a new data set, the Nielsen Consumer Panel data for the US and Mexico, to quantify the magnitude of the potential biases in the ICP due to sampling, quality, and variety. The Nielsen data tracks the shopping behaviour of 40,000 to 60,000 households in the US and 5,000 households in Mexico. Households in the two countries use in-home scanners or diaries to record their purchases of packaged goods from each retail store and shopping trip. The Nielsen data thus has information on prices and quantities purchased by each household of specific packaged goods, identified by a 12-digit barcode, for each shopping visit and each retail store. Furthermore, a price index constructed using the Nielsen data and the ICP methodology aligns well with the price index published by the ICP.
Figure 1 Nielsen vs ICP PPP

Note: The figure plots the ICP for Mexico and the US against the Nielsen-ICP, which is an index generated using the same methodology as the ICP but using the Nielsen data.
We use the Nielsen data to calculate price indexes for 42 items of nondurables in Mexico versus the US. The items of nondurables covered in the Nielsen data account for 60-65% of nondurable spending in the two countries. This alternative price index exploits the richness of the Nielsen data to improve upon the ICP in three ways.
First, to measure the sampling bias that comes from sampling among retail stores, we use the fact that the Nielsen data have information on prices and quantities of all purchases for a representative sample of households in each country. We thus measure the price paid for each product from a representative sample of households from the Nielsen data. The price gap between Mexico and the US using weights from consumer expenditures are 15% lower than the price gap measured using weights from a sample of retail stores. This gap arises from the fact that consumers in Mexico behave differently than in the US. Mexican households shop more frequently and are more likely to purchase only the lower priced items in each store compared to US households. Because of this, sampling prices from stores based on their total sales will overstate the prices paid by consumers in Mexico more than those in the US.
Second, the Nielsen data identify products by barcodes, which we use to identify more than 5,000 identical products (with the same barcodes) in the two countries. The price gap between Mexico and the US among products with the same barcode is 35% higher than the price index of ‘comparable’ products calculated following the ICP's methodology. This suggests that many products that appear similar in the two countries may not in fact be comparable if they do not share a common barcode.
Third, since we observe all the purchases made by households, we can estimate the importance of products available to Mexican consumers but not to US consumers, and vice versa. We find that Mexican varieties missing in the US market matter more than US products not sold in Mexico. When we take into account the differences in the availability of varieties in the two countries, effective prices in Mexico are 20% lower than in the US. The net effect of all three adjustments – for quality, sampling, and variety – lowers Mexican prices relative to the US by 9% compared to the ICP indexes.
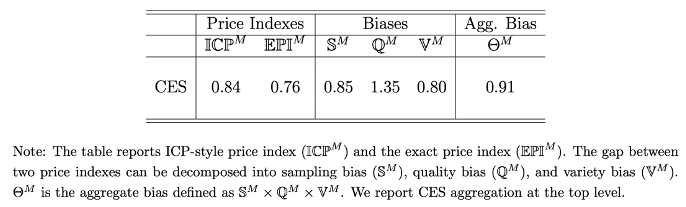
Table 1 Decomposition results for the exact price index
Conclusion
Overall, our results show that the real nondurable consumption inequality across the US and Mexico is lower than that predicted by the ICP estimates. They also highlight the importance of jointly addressing the sampling, quality, and variety biases of the ICP estimates. Addressing the biases in isolation could lead to drastically different conclusions when comparing standards of living across Mexico and the US.
Edittor's note: This column first appeared on VoxEU.org.
References
Argente, D, C-T Hsieh and M Lee (2020), “Measuring the Cost of Living in Mexico and the US”.
Deaton, A and A Heston (2010), “Understanding PPPs and PPP-based national accounts”, American Economic Journal: Macroeconomics 2(4): 1–35.
Feenstra, R C, R Inklaar and M P Timmer (2015), “The next generation of the Penn World Table”, American Economic Review 105(10): 3150–82.