
International trade policies subsidise pollution by favouring dirty industries, who face lower trade barriers
Editor’s note: This article is a slightly modified version of Shapiro (2020).
Many researchers believe that climate change policy is less stringent and less uniform across countries than it could be (Rennert et al. 2022, World Bank 2023). Global trade policy could be a powerful lever for change since around a quarter of the world’s carbon dioxide (CO2) is emitted in the supply chain supporting international trade (Copeland et al. 2022). Imposing taxes on traded goods (i.e. tariffs) that are proportional to CO2 has the potential to help address climate change.
In response to these observations, many countries have proposed pairing climate change policy with a tariff on CO2-intensive traded goods (i.e. a “carbon border adjustment” or “carbon tariff”). The EU, for example, plans to implement such a policy in the next few years.
A new fact: The environmental bias of trade policy
In recent research (Shapiro 2021, Econimate 2021), I assess how international trade policies affect climate change. I ask: how and why do tariffs and trade policies like quotas differ between clean and dirty goods? I find that countries’ trade policies essentially already have carbon tariffs, but these policies are subsidising CO2 emissions instead of penalising them.
My analysis finds that existing tariffs are lower on dirty goods (carbon-intensive goods) and tariffs are higher on cleaner goods (less carbon-intensive goods). This pattern appears in most countries and years, and also for other trade barriers like quotas. In Figure 1, each circle represents a specific industry and country in the global economy. The downward-sloping red line shows that dirtier industries face lower tariffs, which is the opposite of a carbon tariff.
Figure 1: Tariff rates are lower on dirtier goods
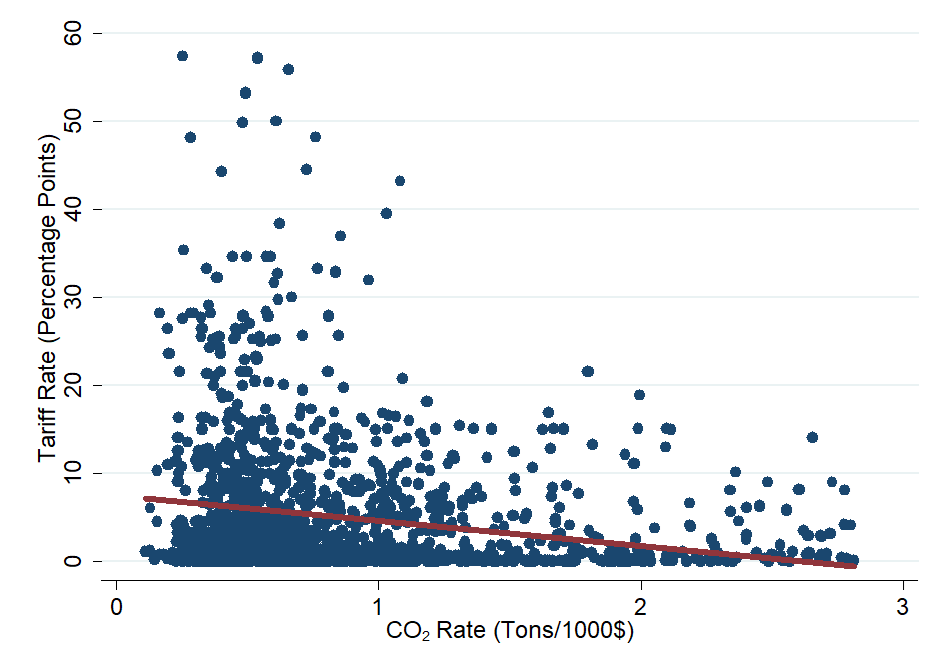
Note: Data represents all countries in the world. Each circle is one industry in one country. Red line is the linear trend.
This environmental bias is large. By putting heftier trade barriers on cleaner goods, the world is on average imposing an implicit subsidy of $85 to $120 per ton of CO2. In other words, trade barriers are rewarding CO2 emissions, and by a large amount. By contrast, many researchers who study climate change think we should have a carbon tax (not subsidy) of nearly $200 per ton (Rennert et al. 2022).
Imagine two bundles of goods that arrive at a port somewhere in the world and suppose producing one of these bundles emitted an additional ton of CO2. The dirtier bundle will face $85 to $120 less in mean tariffs and other trade barriers.
The research shows that the 2018-9 trade war, which raised tariffs on some dirty industries like steel and aluminum, only slightly attenuated this pattern.
Figure 2 shows that, ironically, some of the countries with the largest trade-policy subsidy to CO2 are places like Sweden and Germany that traditionally care the most about the environment. Some of the countries with the smallest trade-policy subsidy to CO2, like Saudi Arabia and Iran, are traditionally less concerned about the environment.
Figure 2: Difference in trade policies between clean and dirty goods, by country
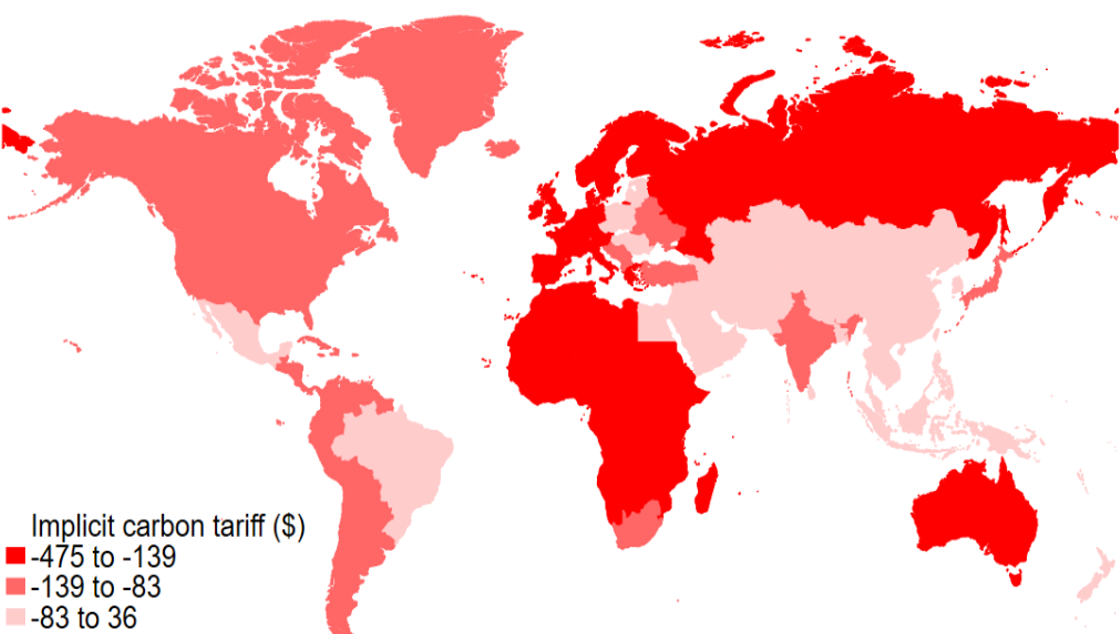
Note: More negative numbers represent a larger subsidy to CO2
Summed across countries, this amounts to a global implicit CO2 subsidy of $550 to $800 billion per year. As a benchmark, direct subsidies to fossil fuel consumption, such as Venezuela’s subsidies to motor fuel or Saudi Arabia’s oil subsidies have a global total of $530 billion.
Why? The influence of lobbying on trade and environmental policies
I arrive at a simple explanation for the bias: industries convince governments that they need cheap inputs.
I consider many explanations for why dirty industries receive low levels of protection, such as rates of political contributions, unionisation, and worker wages.
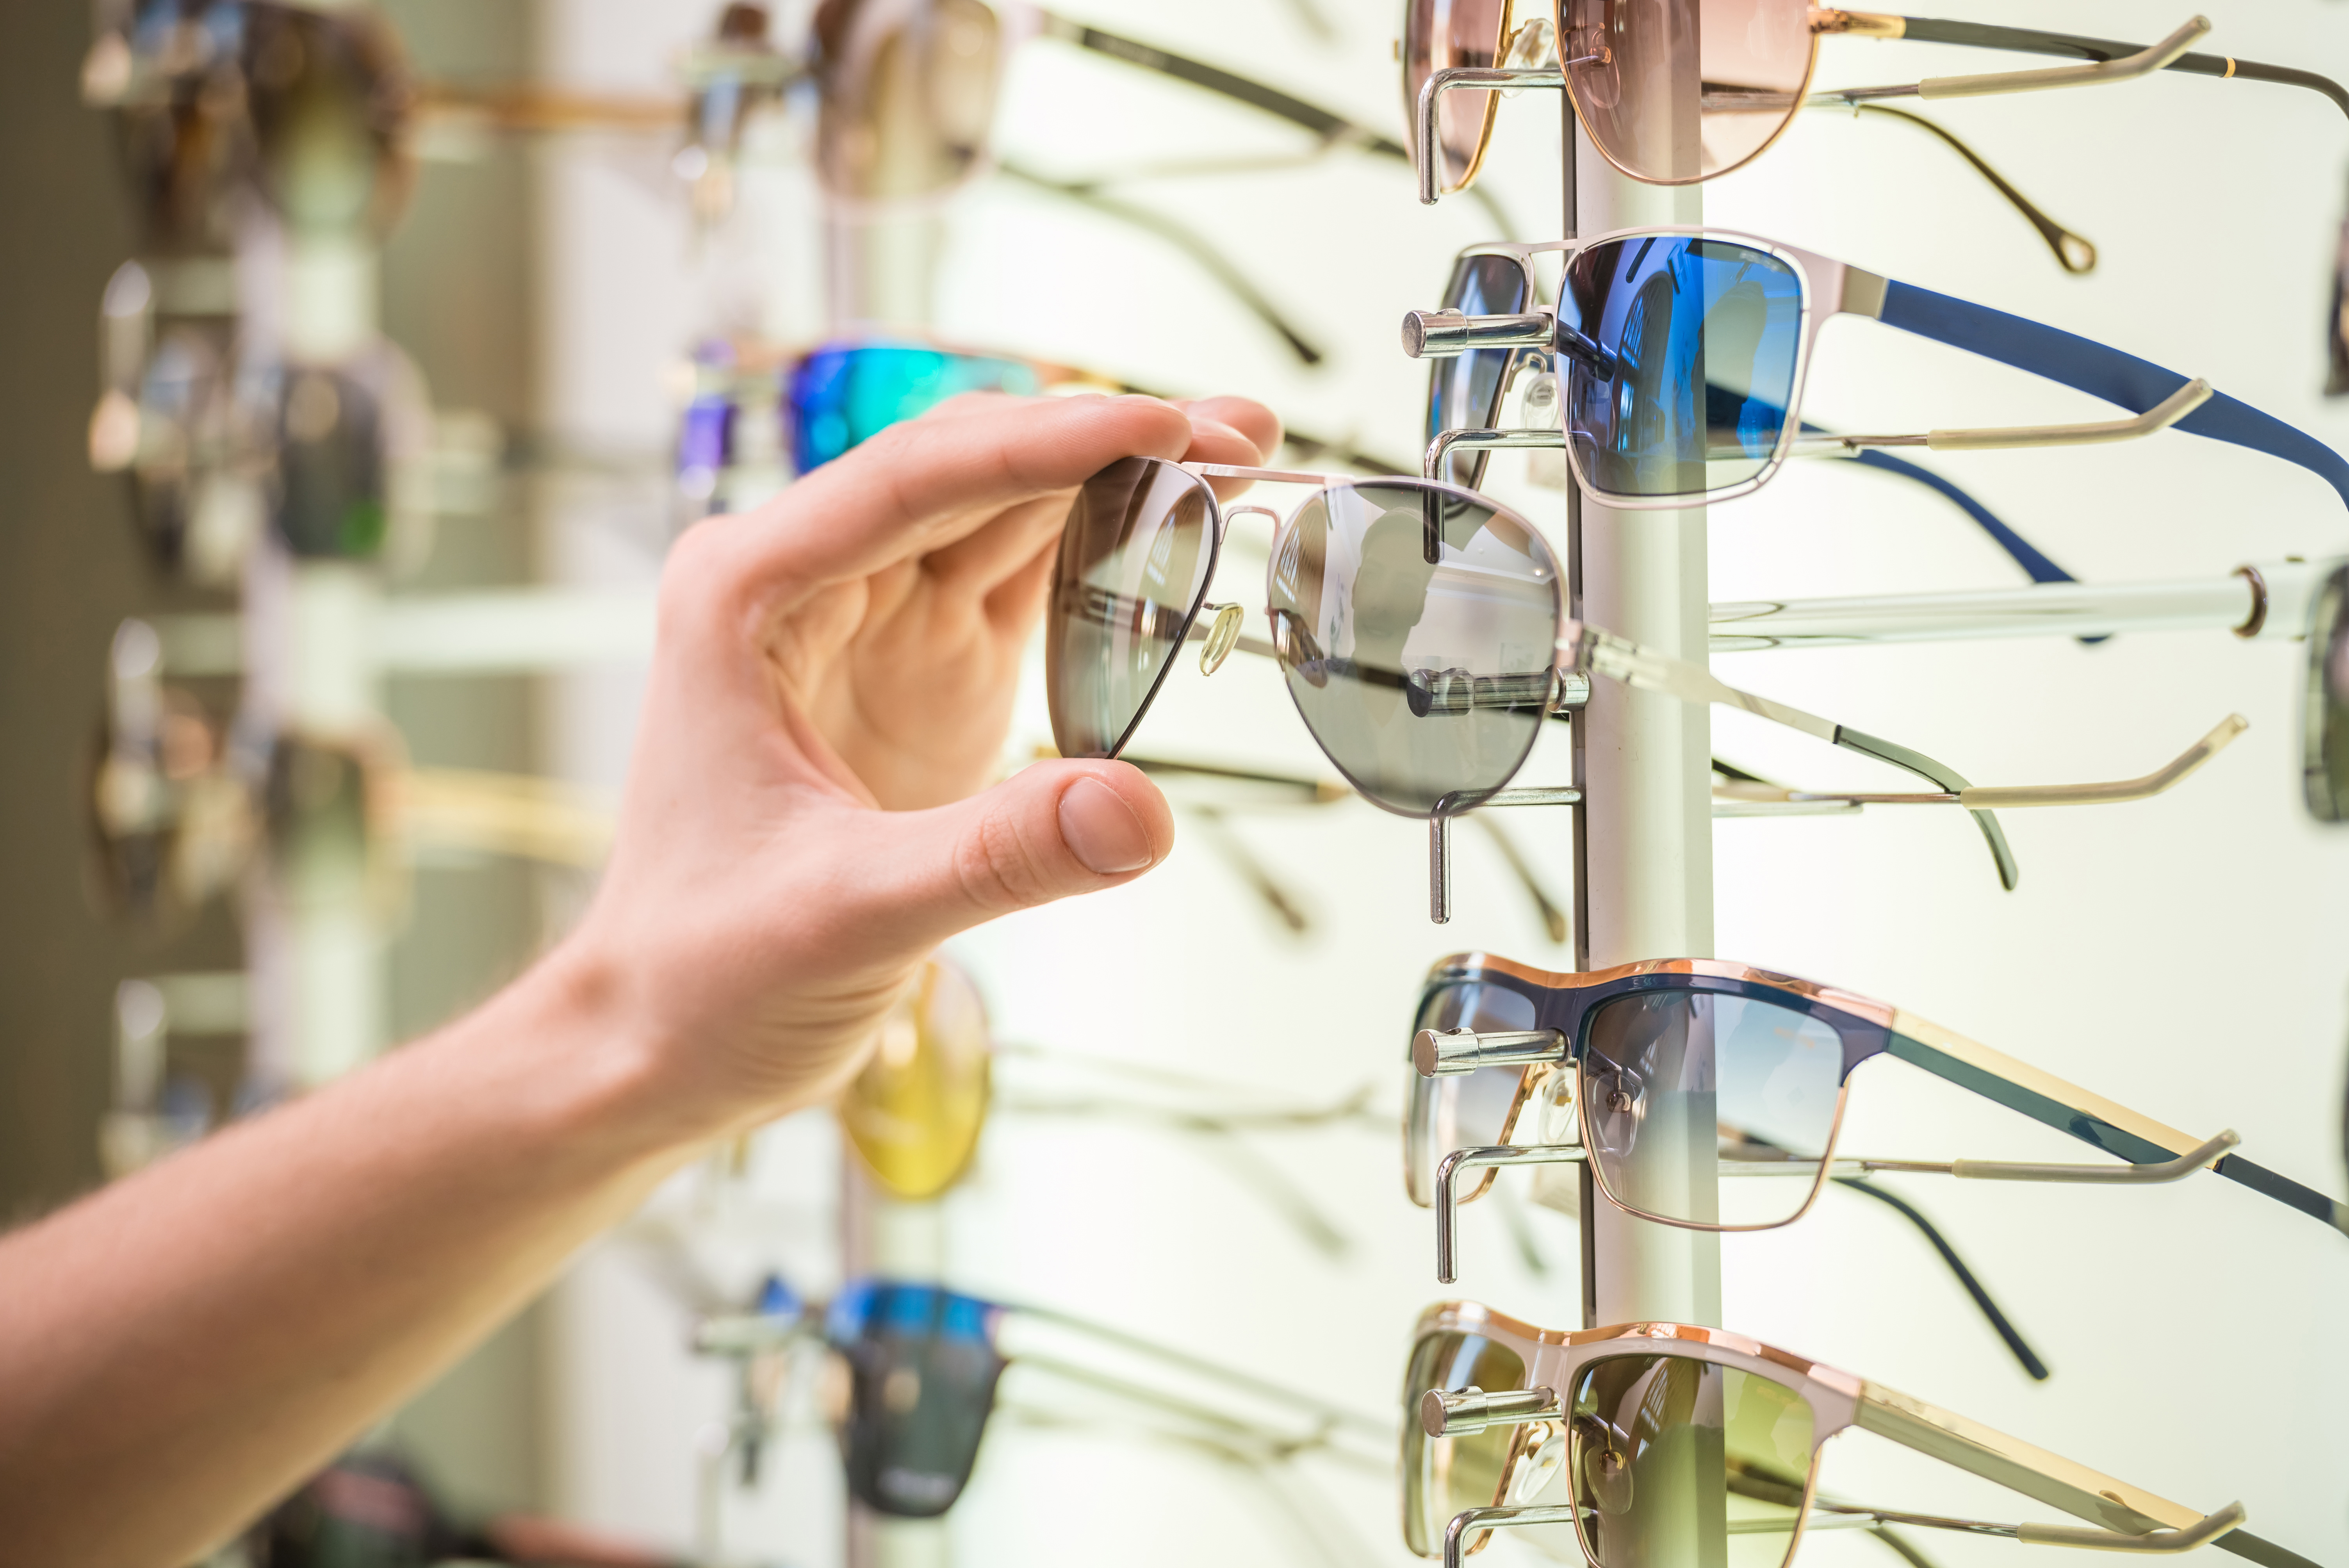
The variable that best explains this pattern of trade policy is the extent to which an industry sells to other firms rather than to final consumers. Economists call this variable “upstreamness.” For example, firms that manufacture copper ingots are upstream—they mostly sell to other manufacturers. Firms that manufacture sunglasses are downstream—they mostly sell to final consumers.
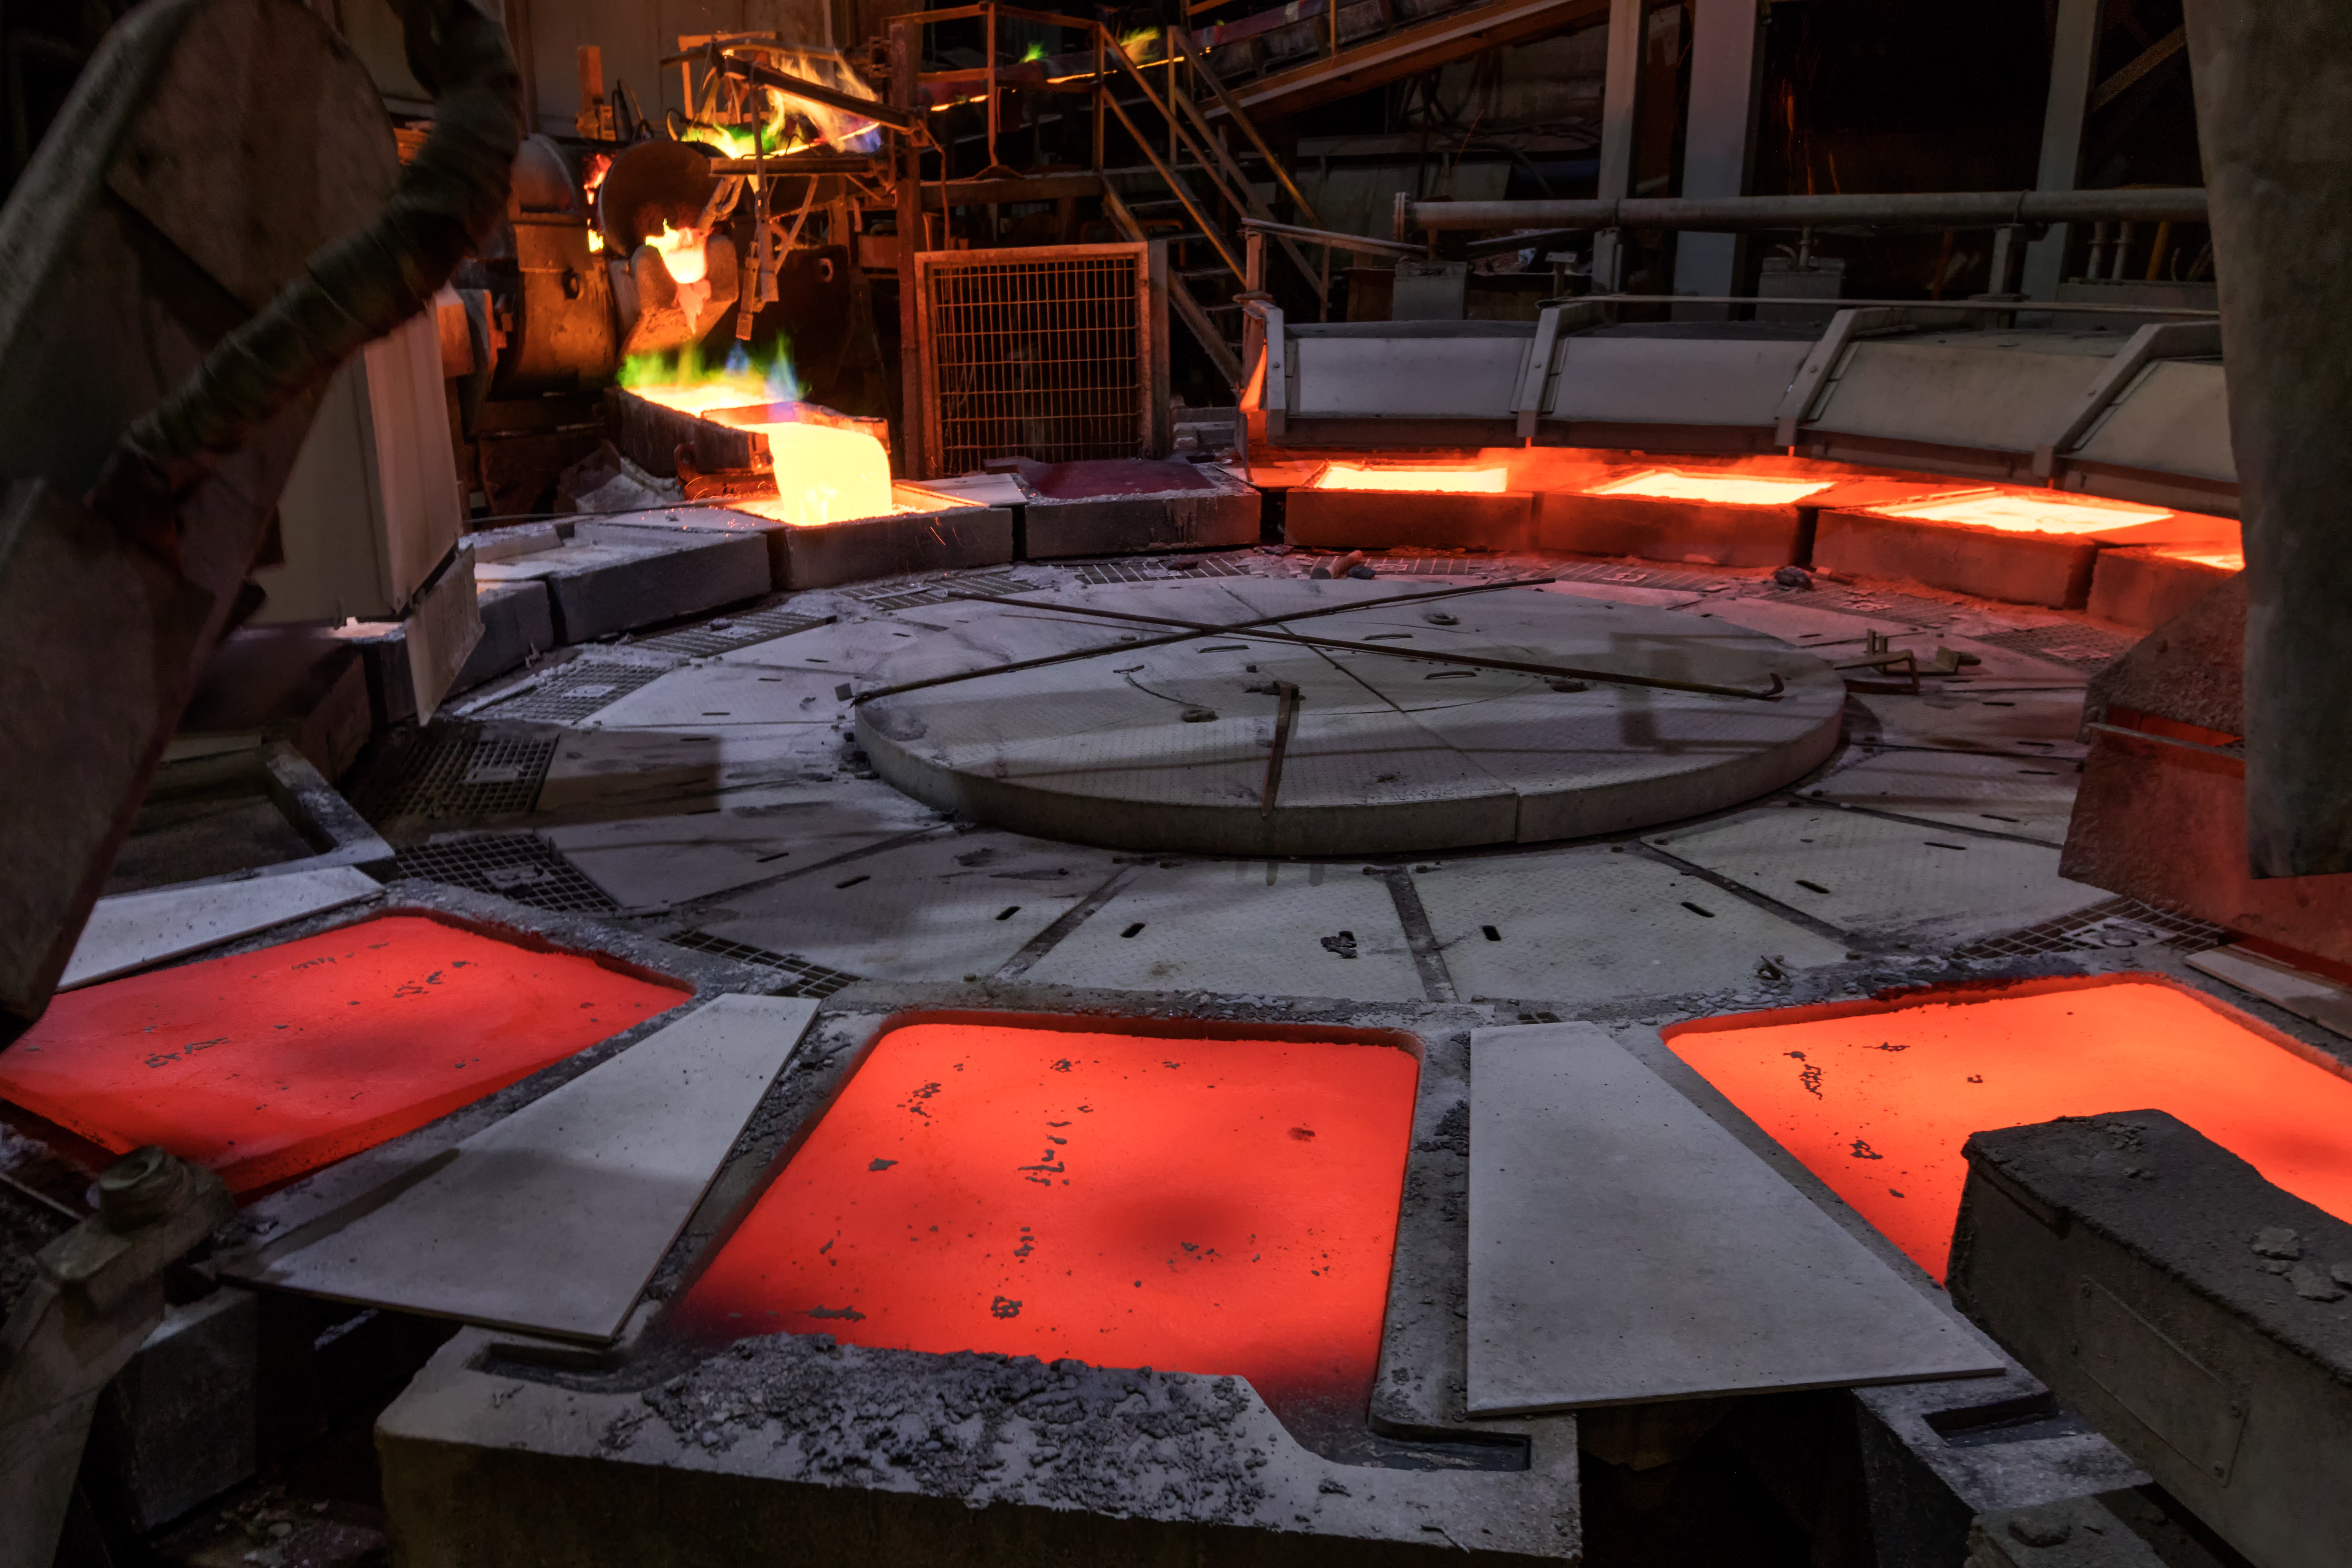
It turns out that more upstream industries are systematically dirtier. The three most upstream manufacturing industries in the U.S. economy are also three of the dirtiest—petrochemicals, copper smelting, and aluminum smelting.
Upstream industries also have lower trade barriers. This pattern has been true at least since the 1960s, when economists began referring to this pattern as “tariff escalation”—as you move from upstream to downstream industries, tariffs escalate. The X-shaped picture in Figure 3 shows both of these patterns—in moving from upstream to downstream industries, trade protection increases but CO2 emission rates fall.
Figure 3: Upstream industries have lower trade protection and higher CO2 emission rates
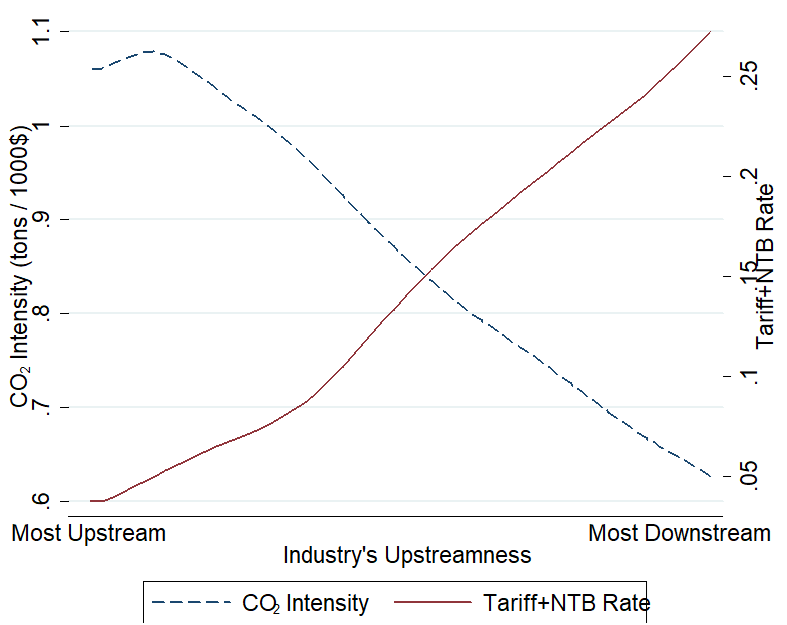
Note: NTB stands for non-tariff barriers, such as quotas. Data represents all countries in the world.
For example, the copper smelting and refining industry is upstream, with a CO2 intensity of 0.8 tons CO2 per thousand dollars of output, and an average tariff of 0.02% (a twentieth of a percent). The optical goods manufacturing industry is downstream, with a CO2 intensity of 0.3 and an average tariff of 1.5%.
Figure 4: Copper refining and smelting is upstream, dirty, and has low tariffs; sunglasses manufacturing is downstream, clean, and has high tariffs
Why do upstream industries receive less protection? Downstream firms want cheap inputs so they can produce at low cost. They lobby for low protection on dirty, upstream goods. By contrast, the main groups who lobby for low protection on cleaner downstream goods are final consumers, who are poorly organised. It is easier to organize five large electrical equipment manufacturers to lobby for cheap copper than to organize 325 million Americans to lobby for cheap sunglasses.
What does it add up to?
Using a mathematical model of trade, production, and pollution for all goods in all countries, I find that if countries had similar trade policy for clean and dirty goods, global greenhouse gas emissions would fall by about the same amount as the effect of two of the world’s largest actual or proposed climate change policies—the European Union’s Emissions Trading System (a cap-and-trade market for CO2) and the Waxman-Markey Bill (a 2009 US cap-and-trade plan). This effect is similar whether countries change trade policy for all goods to the level currently faced by clean industries, or dirty industries, or the average; the key feature is for countries to impose similar trade policies on clean and dirty industries.
Imposing similar trade policies on clean and dirty goods is among the only environmental policies which may appeal to both dirty industries and environmentalists. These groups, who are normally at odds, might both support this policy because it can maintain protection of dirty industries (at least relative to clean industries) while decreasing global CO2 emissions.
Climate change and the environment are rarely part of the debate over tariffs and other trade barriers. The evidence in this paper shows how making the environment part of those policy conversations could provide large benefits.
References
Copeland, B, J S Shapiro, and M S Taylor (2022), “Globalization and the Environment.” In Gita Gopinath, Elhanan Helpman, and Kenneth Rogoff, Handbook of International Economics 5: 61-146.
Econimate (2021), “The Environmental Bias of Trade Policy.” https://www.youtube.com/watch?v=jA-JBIehaxQ
Rennert, K, F Errickson, B C Prest, L Rennels, R G Newell, W Pizer, C Kingdon, J Wingenroth, R Cooke, B Parthum, D Smith, K Cromar, D Diaz, F C Moore, U K Müller, R J Plevin, A E Raftery, H Ševčíková, H Sheets, J H Stock, T Tan, M Watson, T E Wong and D Anthoff (2022), “Comprehensive evidence implies a higher social cost of carbon.” Nature 610: 687-692.
Shapiro, J S 2020, “International Trade Policies Subsidize Pollution.” Energy Institute Blog, UC Berkeley, https://energyathaas.wordpress.com/2020/05/01/international-trade-policies-subsidize-pollution/
Shapiro, J S (2021), “The Environmental Bias of Trade Policy.” Quarterly Journal of Economics 136(2): 831-886.
World Bank (2023), “Carbon Pricing Dashboard.” https://carbonpricingdashboard.worldbank.org/