


Cross-country measures of investment networks reveal how the structure of capital flows across sectors shifts systematically with development. This accounts for around one-third of global income disparities, with the payoff of policies shifting sectorial productivity depending critically on a country’s stage of development and its investment linkages.
Editor's note: The authors have made slides available to accompany this research here.
For decades, economists and policymakers have debated the proximate drivers of economic development – how much capital countries accumulate, both physical and otherwise, and how efficiently they deploy it through productivity. Recognising the importance of capital accumulation and the structural transformation that accompanies development, policymakers have often sought to stimulate investment in ‘priority’ sectors. These sectors shift over time as economies move from an agrarian base towards more industrial or service-oriented structures, as illustrated in Mah’s (2007) account of Korea’s experience and, more recently, Kim et al. (2021).
As early as Hirschman (1958), scholars have argued that certain sectors could play a strategic role, acting as springboards for broader economic development – a view that has resonated in both academic and policy debates. The network of relationships through which sectors produce, import, and use different capital goods may therefore be central to understanding why some countries grow rapidly while others fall behind. Yet despite the importance of this idea, there has been little systematic, cross-country evidence on the structure of production-capital linkages and their role in driving aggregate income disparities.
Our research introduces a novel methodology to construct the first harmonised cross-country measures of these investment networks (Casal and Caunedo 2025). We then uncover new empirical patterns that any account of the development process must address, and quantify the role of the investment network for income per capita differences between poor and rich economies.
Characterising the investment network
We construct harmonised investment networks for 58 countries, spanning income levels from under US$500 to over $80,000 per capita, covering domestic and imported capital for a time period that goes as far back as the 1960s. The time path of our measures allows us to track the development paths of South Korea, India, China, and, most recently, of many sub-Saharan African countries. Our data can be accessed here.
The dataset is constructed from total investment flows recorded in the use tables of the World Input-Output Database, OECD, and Mensah and de Vries (2023). We disaggregate the economy into production sectors – agriculture, ICT, electronics, machinery, transportation equipment, other durables, construction, transport services, and other services – allocating investment flows and uses to and from these sectors. This exercise requires mapping capital goods to production sectors, which we obtain from the BEA’s bridge tables. For example, 60% of computers may be attributed to the electronics sector and 40% to ICT. In addition, we apportion investment flows from the use tables to sectoral uses, following a methodology similar to the BEA’s. Capital flows are assigned in proportion to the occupational composition of each industry, and the relative intensity of occupations in the use of a given capital, following Caunedo et al. (2023). We validate our estimates of the investment network with those in the US (Vom Lehn and Winberry 2023) and Chile, based on firm-to-firm transaction data (Kohn et al. 2025). In both cases, our estimates are remarkably close to those alternatives.
Using our newly constructed measures, a few novel patterns arise.
First, the structure of investment networks varies sharply with income. In poorer countries, construction dominates as the main source of investment goods (Kirchberger 2025), whereas richer countries have far more diversified networks with a rising share of ICT equipment. Other services, including financial intermediation and real estate, also serve as major suppliers of investment goods, but their importance declines with development.
Second, investment networks differ in important ways from the more familiar input-output networks, which trace the flow of intermediate goods across sectors. Sectors are much more likely to use their own outputs as intermediate inputs than as investment goods – a pattern that persists across the income spectrum. For example, agriculture supplies seeds that serve as inputs within the sector, but it does not produce the tractors in which it invests.
The investment network and the passthrough from sectorial productivity to GDP
So, how does this differential role of sectors in the production and use of investment matter for the aggregate economy? Our theory formalises this link and illustrates how it depends on the interaction between the investment network, input-output network, and direct contribution of a sector to GDP.
Figure 1 shows the effect of sectorial productivity growth on aggregate GDP per capita, i.e. sectorial influence. A 1% increase in the productivity of the construction sector translates to a 0.13% increase in GDP among low-income countries. This influence almost doubles among middle-income countries. Sectorial influence for durable goods follows a similar trajectory and magnitude as that of the construction sector despite its lesser role as a producer of investment to other sectors. Sectorial influence for electronics and machinery is smaller in magnitude and common along the development spectrum.
In some sectors, the importance of productivity gains changes substantially as countries develop. The influence of agriculture falls from around 0.30% in low-income countries to 0.04% in high-income countries. By contrast, the influence of ICT rises: a 1% productivity gain in ICT is associated with a 0.12% increase in GDP per capita in low-income countries and a much larger 0.34% in high-income countries. In other words, the same reform in ICT can have very different payoffs depending on a country’s stage of development. This likely reflects complementarities and linkages with the rest of the economy, which we explore further below. Services (excluding ICT) have the highest influence across all stages of development, and its contribution to aggregate GDP grows with income, even as its role as a provider of investment declines.
Figure 1: Sectorial influence along the development spectrum
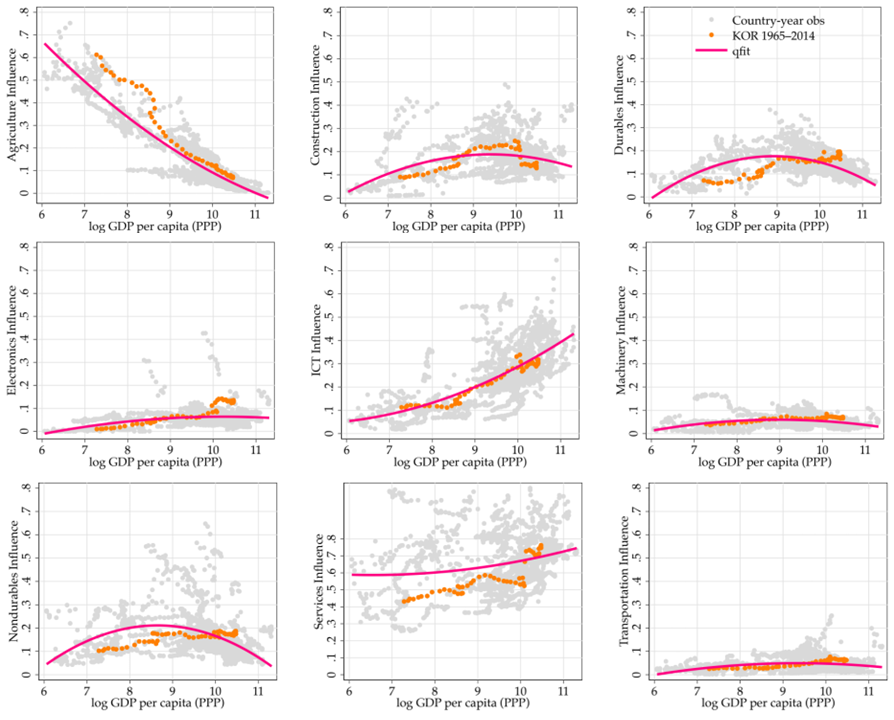
Notes: This table demonstrates sectorial influence for each country-year observation in our sample; it singles out the paths of sectorial influence for South Korea, and overlays a quadratic fit on log GDP per capita in the capita.
A priori, these patterns may reflect standard structural transformation forces and shifts in intermediate input use. To test this, we fix the composition of an economy’s investment network to match that of a poor economy (Korea in 1965) or a rich economy (Korea in 2014).
We find movements in sectorial influence across most investment-producing sectors, with the largest changes in ICT, construction, and services. Imposing Korea’s 2014 investment network raises the sectorial influence of ICT by 20% in median-income countries and lowers that of construction by 10%. These patterns suggest that complementarities with other sectors vary along the income spectrum.
Does the investment network matter for aggregate income differences?
Despite the systematic differences in the passthrough from sectorial productivity to income per capita, the contribution of the investment network for income disparities depends on the interaction between sectorial productivity and sectorial influence. In other words, whenever sectors that have high influence are also the most productive, aggregate GDP will be relatively higher. We infer sectorial productivity so that our model predicts observed differences in income per capita across countries, and across sectors within countries.
We then assess the role of the investment network and find that it contributes around one-third of the differences in income per capita across countries.
Policy implications: Investment networks and development
Heterogeneity. Our findings suggest that interventions with similar effects on sectorial productivity may have very different effects on aggregate productivity depending on the stage of development. Or, in other words, similar sectorial policies that promote investment in specific sectors may have different effects on aggregate GDP depending on the interaction between those sectors and the rest of the economy, particularly through sectorial linkages in the production and use of intermediate inputs.
Trade. Most countries import a large share of their capital goods. This makes the structure of international trade critical for available investment. In our economy, changes in the terms of trade are equivalent to productivity shocks in terms of their pass-through to aggregate GDP. Our counterfactual exercises show that trade accounts for 25% of the income variance explained by the investment networks. Much more can be done with our newly constructed data to evaluate particular policies across countries, including import subsidies and targeted policies for certain technologies embodied in capital.
Future research on investment networks
The policy debate on development has long focused on the balance and reinforcement effects of capital accumulation and productivity growth. Building capacity to produce and trade capital goods, diversifying investment networks, and boosting investment needs across key sectors of the economy seem to be features of the richest economies in the world.
Understanding how diversification naturally evolves with the stage of development is especially important for uncovering the mechanisms that make investment networks central to economic growth. This is directly connected to the identification of production bottlenecks.
Another important question is whether productivity growth in certain sectors needs to be synchronous, or whether there is a ladder in terms of which sectors to develop at which stages of development and how they complement each other.
Our newly constructed data, along with the insights it provides, opens up opportunities to address a wide range of policy-relevant questions.
References
Casal, L, and J Caunedo (2025), “On the investment network and development,” Unpublished manuscript.
Caunedo, J, D Jaume, and E Keller (2023), “Occupational exposure to capital-embodied technical change,” American Economic Review 113(6): 1642–1685.
Gillmore, Kohn D, R Heresi, Quevedo, and Rivera (2025), “Anatomy of the investment network in a commodity-dependent economy,” Central Bank of Chile.
Hirschman, A O (1958), “The strategy of economic development,” Yale University Press.
Kim, M, M Lee, and Y Shin (2021), “The plant-level view of an industrial policy: The Korean heavy industry drive of 1973,” NBER Working Paper.
Kirchberger, M (2025), “Understanding the global construction sector,” VoxDev.
Mah, J S (2007), “Industrial policy and economic development: Korea’s experience,” Journal of Economic Issues 41(1): 77–92.
Mensah, E B, and G de Vries (2023), “Exports and job creation in sub-Saharan African countries: New evidence using the Africa supply and use table database,” Groningen Growth and Development Centre.
Vom Lehn, C, and T Winberry (2022), “The investment network, sectoral comovement, and the changing US business cycle,” The Quarterly Journal of Economics 137(1): 387–433.