

Inequality pushes poor households to sacrifice nutrition for ‘little luxuries’, reshaping basic needs and worsening malnutrition. The implications for poverty programmes are large.
One of the most persistent puzzles in development economics is why calorie consumption has fallen among the poor in India despite rising incomes and declining poverty rates (Deaton and Drèze 2009). This paradox has troubled policymakers: how can material progress coexist with worsening malnutrition?
Our research (Bellet and Colson-Sihra 2025) suggests that rising inequality is a big part of the answer. Beyond the traditional focus on prices, incomes, and food availability, inequality alters what poor households perceive as necessary. In more unequal settings, the poor shift resources away from basic staples like cereals and towards ‘little luxuries’, i.e. goods consumed by richer peers such as dairy, processed foods, and energy. This change in the hierarchy of needs comes at a high nutritional cost.
From Engel’s law to relative deprivation
Economists have long distinguished between necessities and luxuries. Engel’s law (1857) showed that food, especially calories, accounts for a smaller share of household budgets as incomes rise. For poor households, food has typically been treated as the most basic necessity.
But social comparison matters. Relative deprivation theory (Runciman 1966) argues that people judge their situation not in absolute terms but by comparison with those who are better off. This suggests that inequality can shift needs themselves and affect the composition of what Ravallion (2016) describes as the ‘consumption floor’. For the poor, what counts as a ‘necessity’ may become influenced by the consumption norms of richer neighbours.
Evidence on this mechanism remains limited, especially for the very poor. In the US, research shows that low-income households save less when exposed to wealthier peers (Bertrand and Morse 2016). But surveys in rich countries rarely capture the very bottom of the distribution. In developing countries, where malnutrition is widespread, we know little about how inequality shapes basic needs.
Understanding inequality and malnutrition in India
India provides a revealing case. Between the 1980s and 2000s, economic liberalisation triggered rapid growth alongside sharp increases in inequality (Aghion et al. 2008, Chancel and Piketty 2019). At the same time, detailed household expenditure surveys conducted by the National Sample Survey Organisation (NSS) tracked how households – roughly one third of whom live below the poverty line – allocated their budgets.
This data reveals a paradox: even as poverty fell, the share of households suffering malnutrition did not, particularly among the poor.
Inequality reduces calorie intake, increases spending on luxuries
We first document that higher exposure to inequality is associated with a decline in calorie intake among poor households. Using Engel curves, we compare calorie consumption across households with similar incomes but varying exposure to richer neighbours. In line with relative deprivation theory, inequality exposure captures the average income gap between poor households and relatively wealthier households in their district. The result is striking: we estimate that inequality-exposed poor households consume around 130 to 186 fewer calories per person per day, the equivalent of one to one and a half adult portions of cooked rice.
This gap can be shown graphically by splitting the sample of poor households into two groups based on how exposed they are to inequality. The left panel of Figure 1 shows a downward shift in calorie intake at all levels of expenditure for those more exposed to inequality (black line).
Figure 1: Engel curves showing calorie intake declining and luxury expenditure rising with inequality exposure
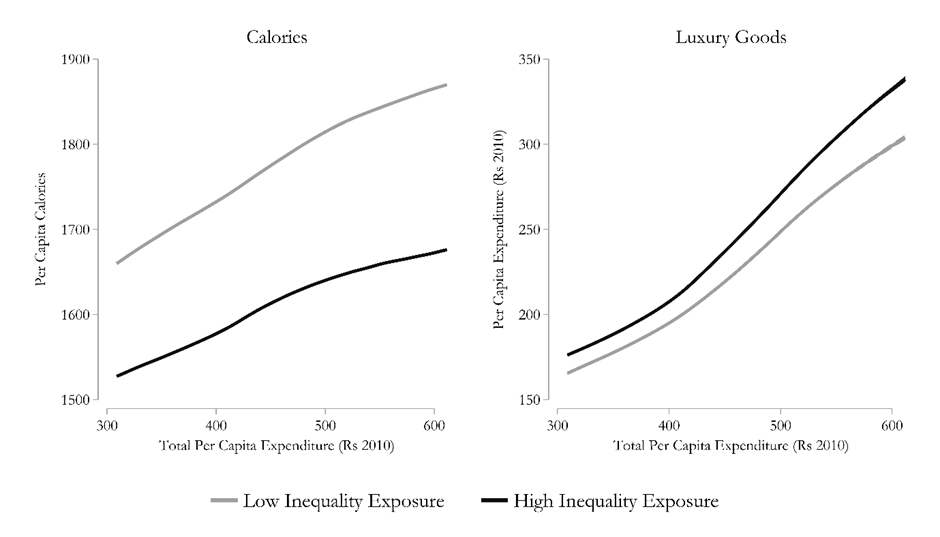
Why does inequality reduce calorie intake? Our analysis points to a reallocation of spending away from basic necessities and towards goods consumed by richer households. The right panel of Figure 1 shows that poor households spend relatively more on goods whose income elasticity is above 1 (e.g. dairy products, processed food and drinks, spices, energy, and even sweets or intoxicants). These are ‘little luxuries’ that signal social inclusion or provide short-term satisfaction.
Of course, inequality may be correlated with other local factors that also affect consumption. To address this, we use an instrumental variable (shift-share) strategy that exploits historical exposure to trade liberalisation shocks. This approach allows us to isolate the causal impact of inequality itself. Our results confirm that higher inequality directly reduces calorie intake among the poor while increasing spending on little luxuries.
Shifting the hierarchy of needs
Is the rise in luxury expenditure really evidence of a shift in needs? To disentangle needs from supply-side factors (like income and price changes), we estimate a structural demand system. This approach allows us to separate the basic physiological component of demand from the relative, inequality-driven component.
Using these structural estimates, we can construct a ‘pyramid of needs’ for each district in India. The pyramid ranks goods according to their income elasticities, or how much demand for a good rises with income. The lower the elasticity, the more ‘necessary’ the good is. Each bar in Figure 2 represents the inverse of a good’s elasticity: wider bars indicate goods that households consider more necessary.
Figure 2: ‘Pyramid of needs’ constructed from structural income elasticities, comparing average and high-inequality districts
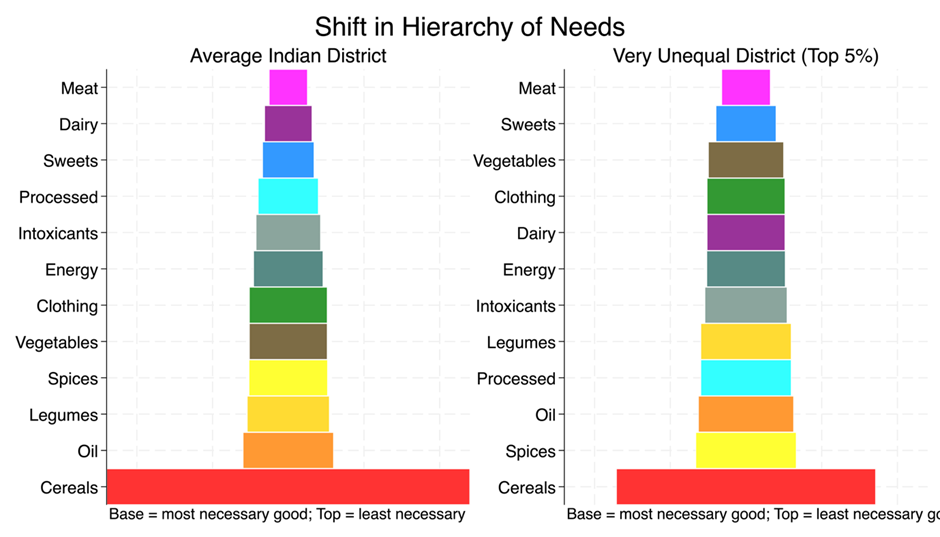
In the average Indian district, cereals – the cheapest source of calories – form the broad base of the pyramid: they are the most necessary good. But in more unequal districts, the pyramid’s shape changes. Cereal remains at the bottom, but the bar becomes smaller, while the bars for dairy, processed foods, and spices grow wider, which makes these goods move down the hierarchy: they become more needed.
Inequality, in other words, narrows the distance between necessities and luxuries. This shift in needs explains more than two-thirds of the overall decline in calorie consumption among the poor in India during our study period (Table 1).
Table 1: Calorie consumption and malnutrition with inequality
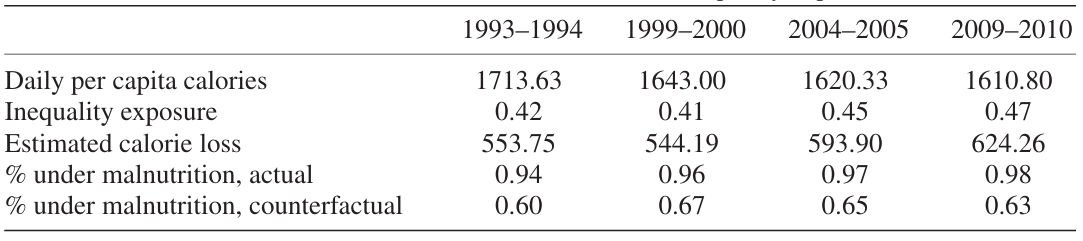
Notes: Malnutrition is calculated using the standard Indian thresholds: daily per capita consumption below 2,100 (urban) or 2,400 (rural) calories.
Policy implications: Poverty lines and food security in an unequal world
These findings have several implications for how we measure and address poverty:
- Beyond absolute poverty lines: Traditional poverty measures assume that basic needs are fixed and/or primarily nutritional. Our results suggest that in unequal societies, social needs (inclusion, status, dignity) can crowd out nutrition, even among the very poor. Poverty lines that ignore this risk underestimate deprivation.
- Food security programmes must adapt: India’s calorie decline occurred despite food subsidy schemes and falling poverty. If inequality reshapes needs, subsidies for cereals alone may not be enough. Programmes may need to account for competing needs on household budgets and the social pressures that drive them.
- Inequality as a health issue: The calorie losses we document are not trivial. Tackling inequality is therefore not only a matter of fairness, but also of public health.
While our evidence comes from India, the mechanism likely applies more broadly. In many developing countries, inequality is rising alongside rapid urbanisation and shifting consumption patterns. Poor households are increasingly exposed to the lifestyles of the affluent through media, markets, and migration, and may adjust their spending accordingly. The result could be a global challenge: progress in reducing income poverty coexisting with persistent or worsening nutritional poverty.
References
Aghion, P, R Burgess, S Redding, and F Zilibotti (2008), “The unequal effects of liberalization: Evidence from dismantling the License Raj in India,” American Economic Review, 98: 1397–1412.
Bellet, C, and E Colson-Sihra (2025), “Does inequality affect the needs of the poor?” Journal of the European Economic Association, 23: 1272–1308.
Bertrand, M, and A Morse (2016), “Trickle-down consumption,” Review of Economics and Statistics, 98: 863–879.
Chancel, L, and T Piketty (2019), “Indian income inequality, 1922–2015: From British Raj to Billionaire Raj?” Review of Income and Wealth, 65(S1): S33–S62.
Deaton, A, and J Drèze (2009), “Nutrition in India: Facts and interpretations,” Economic and Political Weekly, XLIV: 42–65.
Engel, E (1857), “Die Productions-und Consumtionsverhältnisse des Königreichs Sachsen,” Zeitschrift des Statistischen Bureaus des Königlich Sächsischen Ministeriums, 8: 1–54.
Ravallion, M (2016), “Are the world’s poorest being left behind?” Journal of Economic Growth, 21: 139–164.
Runciman, W (1966), Relative Deprivation and Social Justice, Routledge, London.