
Global poverty trends look radically different depending on the poverty line used. A new measure that doesn’t depend on ‘lines’ – the average time needed to earn a dollar – shows that global poverty has fallen sharply, by about 55% since 1990. This was driven mainly by income growth in East Asia.
Editor's note: The author has made slides available here.
Has global poverty fallen since 1990? Depending on which poverty line you use, the answer ranges from “we’ve made huge progress” to “nothing has changed”.
Using the World Bank’s extreme poverty line of US$2.15/day (in 2017 PPP), the share of people in poverty fell from 38% of the world’s population in 1990 (about 2 billion people) to 8.5% in 2024 (690 million people) (Figure 1). This is often cited as a historic success.
Figure 1: Global poverty rate over time

Source: PIP data (World Bank). Notes: Income is measured at 2017 $PPP per person per day.
But raise the line – say to $21.5/day, as suggested by Pritchett and Viarengo (2025), or $30/day, as argued by Roser (2024) – and the picture changes entirely. The poverty rate is then extremely high, above 75%, and has barely budged since 1990. In absolute terms, the poverty headcount has even increased, from over 4 billion poor people in 1990 to over 6 billion poor people in 2024. Based on these numbers, the fight against global poverty appears to have failed.
This divergence is not just a statistical quirk. All mainstream poverty measures share the same fundamental feature: they ignore everyone above the chosen line. With the extreme poverty line of the World Bank ($2.15/day), someone earning $2.16/day is treated as equally non-poor as someone earning $10, $100, or $1,000/day. Billions of low-income people – who most would agree still live in poverty – are therefore excluded from the statistics. And because there is no consensus on where to set the line, it is tempting to pick the one that tells the story you want.
A new approach: Poverty without a poverty line
In Sterck (2026), I propose to measure income poverty without a poverty line. The idea is to measure poverty across the entire income distribution, rather than classifying people as poor or non-poor based on an arbitrary threshold.
The measure’s key intuition is simple: if person A earns half as much as person B, then A is twice as poor. Poverty is therefore simply measured as the reciprocal of income, and its unit is simply inverted. If incomes are measured in dollars per day ($/day), poverty is measured in days per dollar (days/$).
Average poverty is simply the average time it takes to earn $1 in a given population.
In 2024, that value was equivalent to:
- 1 day in DR Congo, Madagascar, South Sudan, and Mozambique
- 12 hours in Haiti
- 2 hours in China
- 85 minutes in the US
- 25 minutes in Switzerland.
This way of measuring poverty follows a logic that is widely used in other fields, where reciprocal relationships are common. In running, for example, pace is simply the reciprocal of speed. A runner covering 20 kilometres per hour is twice as fast as one covering 10 kilometres per hour. Conversely, the second runner is twice as slow, needing 6 minutes per kilometre when the first one needs only 3 minutes. Similar reciprocal relationships appear throughout the physical sciences: for example, between resistance and conductance, or between frequency and period.
Using a survey experiment with experts (N = 245) and online samples in four countries (N = 2,268), I provide direct evidence that people naturally think about poverty in proportional terms. After being reminded of a poverty line equivalent to $2.5 per day, respondents were asked to compare a person earning $1 per day with one earning $2 per day. Fewer than one-third judged them to be equally poor, as implied by the poverty headcount, and fewer than 10% judged the poorer person to be three or nine times poorer, as implied by the poverty gap and squared poverty gap. By contrast, more than half said the $1-per-day earner is twice as poor, in line with measuring poverty as the reciprocal of income. In a follow-up task, almost all respondents chose to give an extra dollar to the poorer individual, even though giving it to the better-off individual would reduce the poverty headcount. These results, which are robust to many variations, suggest that most people do not naturally think about poverty in terms of a fixed poverty line, but rather in proportional terms, where earning half as much means being twice as poor.
Why this measure is different
Average poverty has four key features, which make it unique:
- No poverty line needed: Poverty is measured across the entire income distribution, so comparisons are not affected by arbitrary thresholds.
- Distribution-sensitive: A $1 gain for someone at $1/day reduces poverty more than the same gain for someone at $2, $5, $10, or $100/day. This addresses a major limitation of the headcount and poverty gap, which ignore the severity of poverty.
- Decomposable: Average poverty is subgroup-decomposable, meaning that changes that occur in subgroups (e.g. countries) are consistently reflected at higher levels (e.g. globally). Average poverty can also be decomposed exactly into average income and a new inequality measure, which itself has interesting properties (Moramarco and Sterck 2025).
- Intuitive units: Measured in days per dollar, the metric is easy to explain to policymakers and the public.
Global poverty fell sharply since 1990
Using data from the World Bank’s ‘Poverty and Inequality Platform’, I calculated average poverty for 218 countries between 1990 and 2024. I find that global poverty fell by 55%, from just under half a day to earn $1 in 1990 to about 5 hours in 2024 (Figure 2).
Using the decomposition properties of average poverty, I find that East Asia is the largest contributor to global poverty reduction, where average poverty fell by about 83%. Average poverty also declined sharply in Latin America and the Caribbean (-60%), Eastern Europe (-57%), and South Asia (-51%). In comparison, poverty reduction was more modest in sub-Saharan Africa (-32%), where people still need about half a day to earn $1.
Figure 2: Average poverty globally
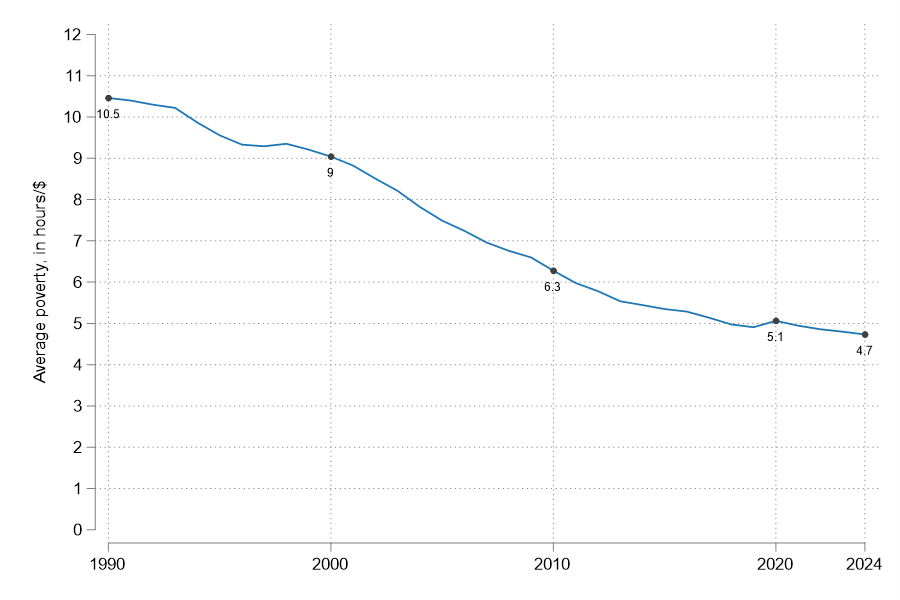
Source: PIP data, World Bank.
Growth versus inequality: Which mattered more?
Average poverty can fall for two very different reasons: incomes may rise broadly across the population as economies grow, or incomes may become more equally distributed. Country experiences illustrate these different pathways (Figure 3).
In the US, average poverty increased by about 1.2% per year since 1990, as inequality growth (2.3% per year) outpaced income growth (1% per year). In Belgium, declining inequality combined with rising average income led to a sharp fall in average poverty of about 2.8% per year. In Zimbabwe, rising inequality and falling average incomes both contributed to large increases in average poverty, while in Ghana, strong income growth more than offset rising inequality, leading to substantial poverty reduction.
Applying this decomposition to all countries, I show that 78% of the change in global poverty since 1990 came from income growth while 21% was due to changes in inequality. In other words, while inequality trends matter, most of the action in global poverty reduction over the last three decades came from economic growth.
Figure 3: Growth in average income, poverty, and inequality
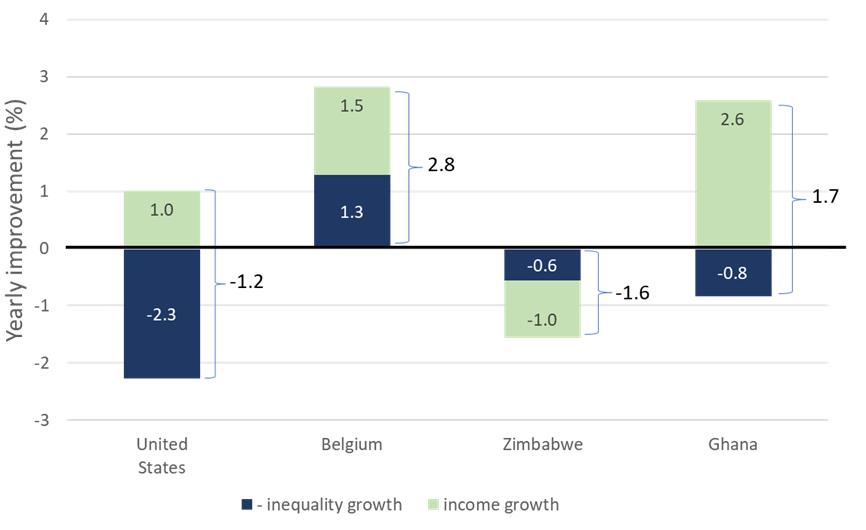
Source: PIP data, World Bank.
Policy relevance of poverty measures
Current poverty measures force us to define poverty lines, which hide as much as they reveal. By reframing poverty as the reciprocal of income, I propose a new poverty measure that considers the full income distribution in an intuitive, distribution-sensitive way, without arbitrary thresholds.
Reflecting its practical value, the World Bank has already adopted this metric, under the name ‘Prosperity Gap’, as its core indicator for tracking shared prosperity (Kraay et al. 2023). The measure can also be easily adapted to measure other aggregates when inequality matters, such as food insecurity or calorie poverty (Bruni and Sterck 2025a, Bruni and Sterck 2025b).
So, has the fight against global poverty failed? Globally, the answer is unambiguously no. The past three decades have seen a dramatic fall in global poverty by the new measure, driven mainly by growth in East Asia.
However, progress remains uneven. In the poorest countries, people still need a full day to earn just $1, while people in Switzerland or Belgium need less than 30 minutes to make the same amount. Closing this gap remains one of the central challenges for global development policy.
References
Bruni, V, and O Sterck (2025a), “The welfare and general-equilibrium impacts of aid cuts,” Unpublished manuscript.
Bruni, V, and O Sterck (2025b), “The welfare and market effects of delays in humanitarian assistance,” Unpublished manuscript.
Kraay, A, C Lakner, B Özler, B Decerf, D M Jolliffe, O Sterck, and N Yonzan (2023), “The prosperity gap: A proposed new indicator to monitor shared prosperity,” Unpublished manuscript.
Moramarco, D, and O Sterck (2025), “A new class of decomposable inequality measures,” Unpublished manuscript.
Pritchett, L, and M Viarengo (2025), “Raising the bar: A poverty line for global inclusion,” Unpublished manuscript.
Roser, M (2024), “We need a new global measure for poverty,” Unpublished manuscript.
Sterck, O (2026), “Poverty without poverty line,” Unpublished manuscript.