

View Chapter:
Downloads:
Chapter 2
The State of Air Pollution Exposure
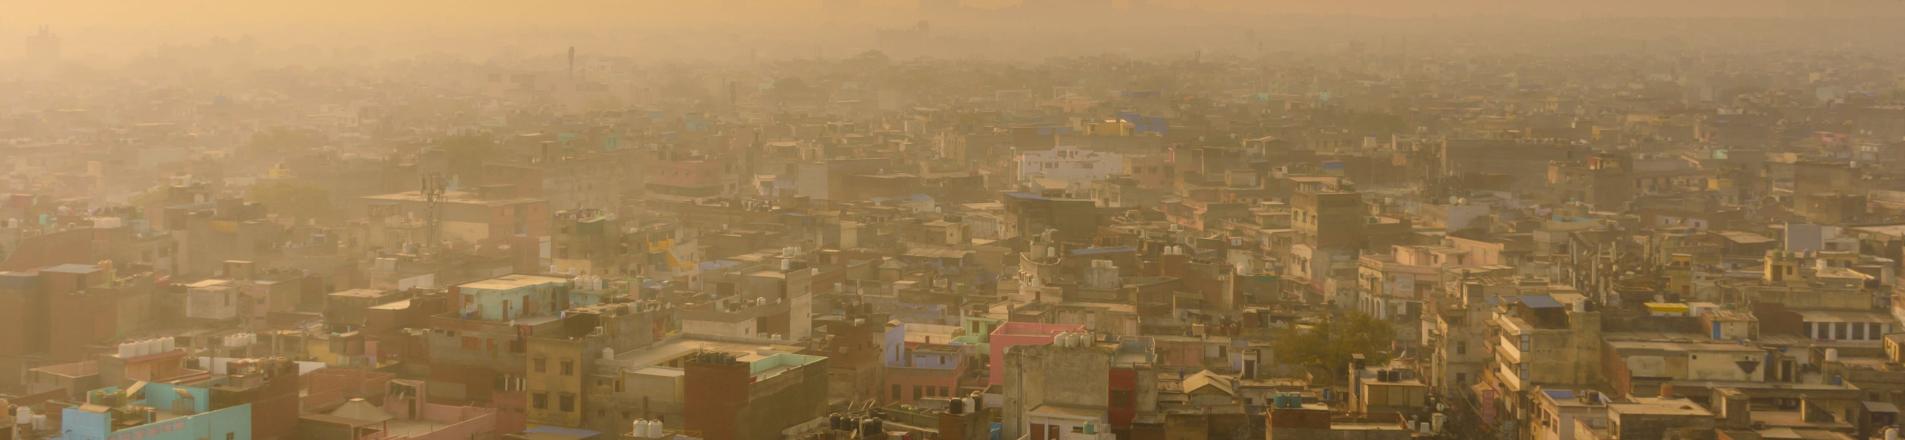
Air pollution is reducing human lifespans across the planet by an average of nearly two years, about five times more than unclean water and tropical diseases including malaria (Greenstone et al. 2025a). As a risk factor for premature death, it is now second only to high blood pressure, and the burden falls overwhelmingly on low- and middle-income countries (Health Effects Institute 2025).
A large literature across disciplines has sought to document the different negative impacts of air pollution: increased mortality, reduced productivity, lower cognitive performance, and decreased agricultural yields (Bharadwaj et al. 2017, Burney and Ramanathan 2014, Zhang et al. 2018, Graff Zivin and Neidell 2012, Chang et al. 2019, He et al. 2019, Jayachandran 2009, Ebenstein et al. 2017). This evidence makes clear that cleaning the air, or reducing individual exposure to polluted air, has significant social benefits. Achieving this goal, in ways that do not hinder economic growth, is therefore a central policy and research challenge. Since the problem is most acute in poor countries, policy solutions must also be feasible given the constraints of state capacity, individual and government budgets, and local political economy considerations.
Before reviewing what we know about impacts and solutions, it is helpful to understand where pollution comes from and who is most strongly exposed at a global level. Historically this was difficult to do because air pollution was measured only by environmental regulators using expensive ground-based monitors. The cost of so-called “reference-grade” monitors has meant that these devices are far more common in rich countries than they are in poorer (and more polluted) parts of the world.[1] In the last decade or so, advances in using satellite data to measure pollution have made it possible to produce estimates of air quality that have near universal spatial and temporal coverage (Shen et al. 2024).
Figure 1 shows a population-weighted estimate of average fine particulate air pollution in 2023 from a dataset developed by Shen et al. (2024).[2] Perhaps the most striking observation is that poor countries tend to have poor air quality.
Figure 1: Satellite-derived estimates of fine particulate air pollution in 2023
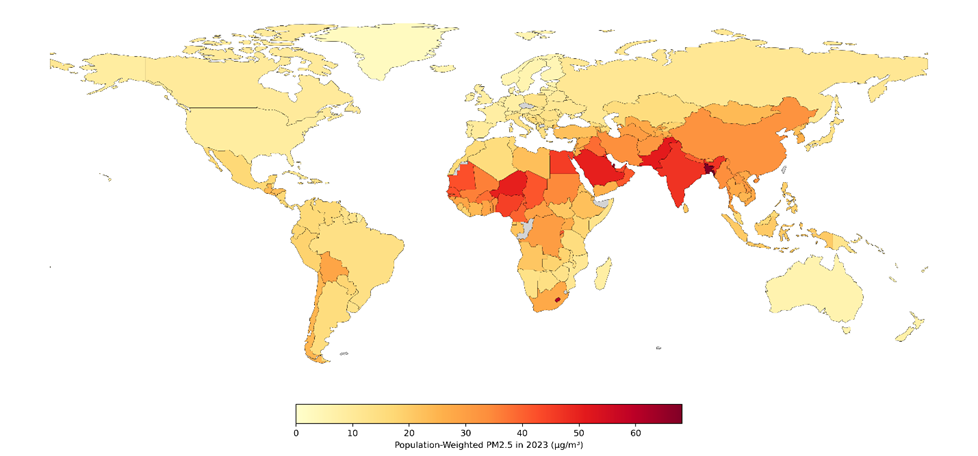
Source: Shen et al. (2024)
Pollution levels are very high in South and West Asia, North and Central Africa, and to a slightly lesser degree, China and parts of South America. Although air pollution is a global problem, and many parts of the developed world do exceed the WHO guideline of 5 µg/m3, it is a vastly more severe challenge in countries that are relatively poor. To provide some illustrative examples, population-weighted average levels of fine particulate pollution in 2023 were 32.6 µg/m3 in China, 47.1 µg/m3 in India, 20.4 µg/m3 in Indonesia, 45.5 µg/m3 in Egypt, and 51.1 µg/m3 in Pakistan.[3]
The burden of pollution exposure is also unequally distributed. The relatively rich can buy themselves air purifiers at home, go to work in air-conditioned cars, and spend the day in relatively clean offices (Sun et al. 2017). Conversely the poor may sleep on footpaths or in low-quality housing, and work in highly exposed environments such as construction sites or open-air markets (da Motta Singer et al. 2023). Approximately 716 million people living on less than $1.90 per day reside in areas with unsafe PM2.5 levels, and within-country geographic disparities in exposure are often larger than between-country differences (Rentschler and Leonova 2023). More work quantifying these inequities is desperately needed.
Figure 2 uses air quality data from the IQAir open-source monitoring database to describe the distribution of pollution across cities in a few illustrative countries.[4] Cities out of compliance with WHO norms exist in all the countries shown, but levels in India (mean = 51.39 µg/m3) are significantly higher than the US (mean = 10.27 µg/m3). For India, the cleanest cities in this dataset are generally more polluted than the dirtiest in the US and the UK.
Figure 2: Average ambient fine particulate concentrations for cities in China, India, Mexico, UK, and the USA
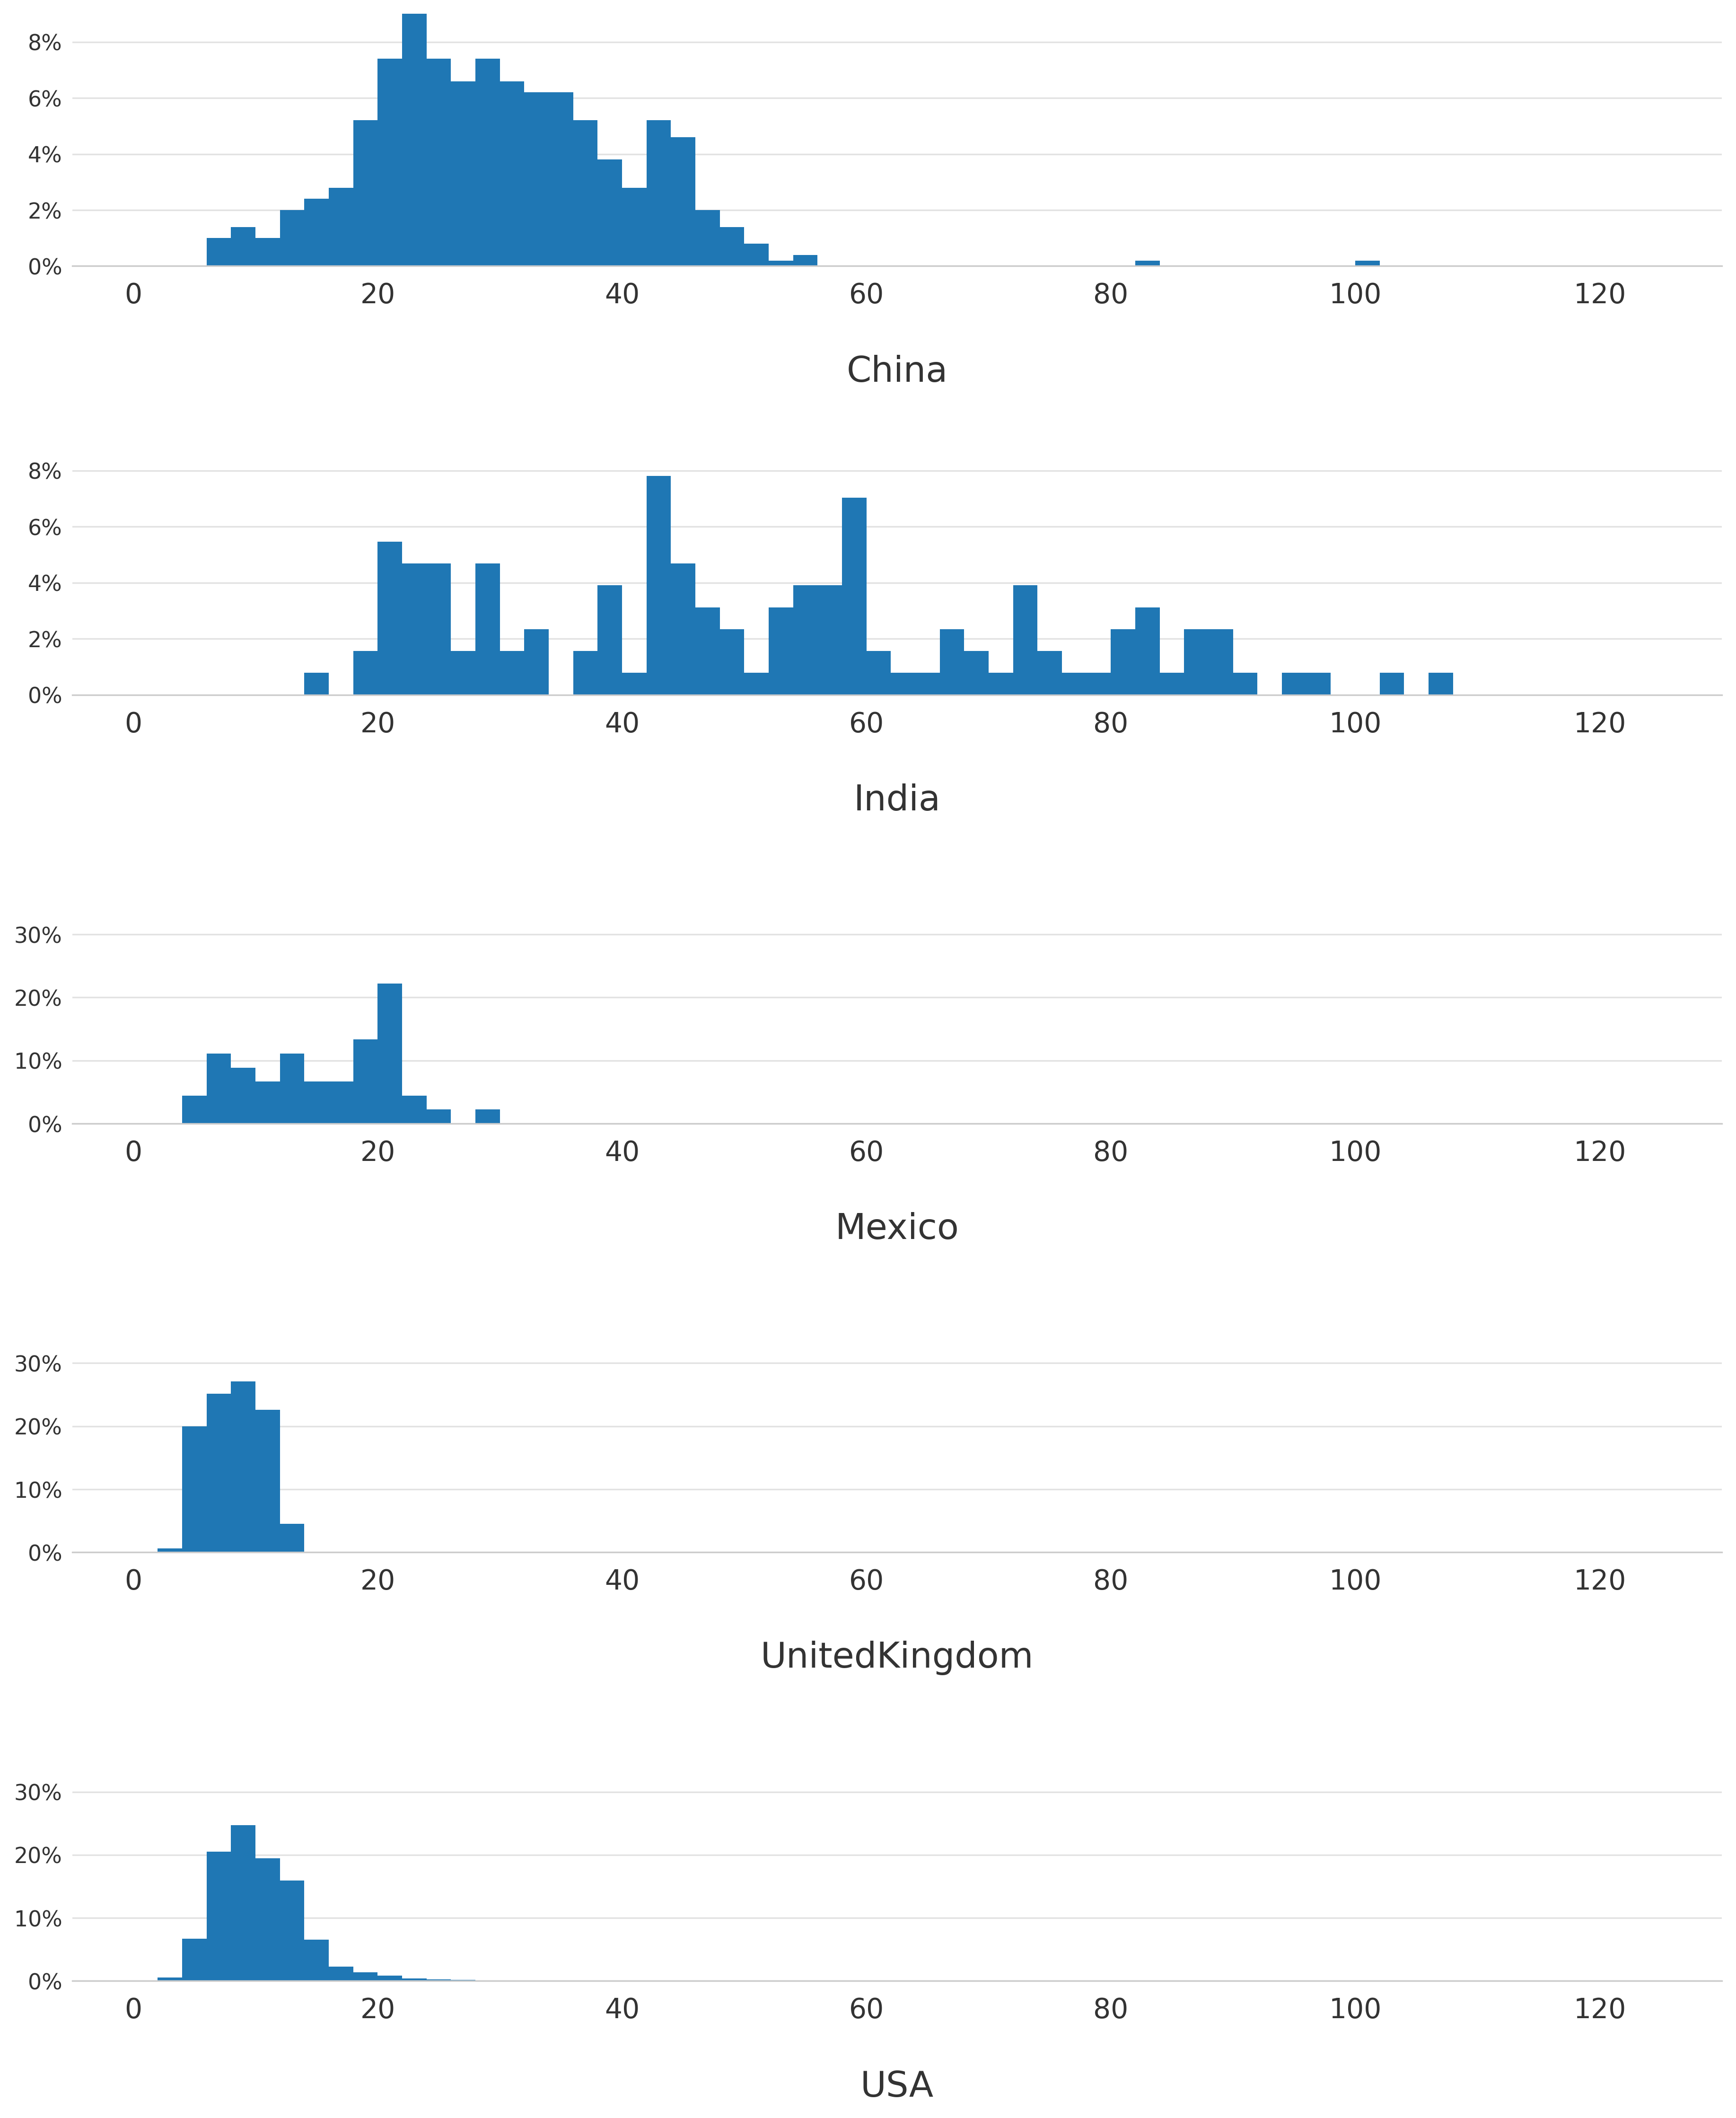
Source: IQ Air (2021)
Cross-sectional patterns do not tell us whether things are getting better or worse. Figure 3 shows the percentage change in air pollution between 2013 and 2023, and two patterns stand out. First, pollution has worsened across most of South America and parts of Africa, and the highly polluted regions of South and West Asia have seen little or no improvement. In South America, much of this is driven by fire activity and deforestation in and around the Amazon basin – a different policy challenge than industrial or transport emissions. Second, China has achieved impressively large improvements in air quality over a relatively short period of time. Following severe pollution episodes in 2012–2013 that galvanised public concern, China formally declared a “war on pollution” in 2014 under Premier Li Keqiang, backed by the revised Environmental Protection Law that took effect in 2015 (Greenstone et al. 2021). Satellite data confirms that these efforts produced measurable results.[5]
Figure 3: Percentage change in fine particulate air pollution from 2013 to 2023
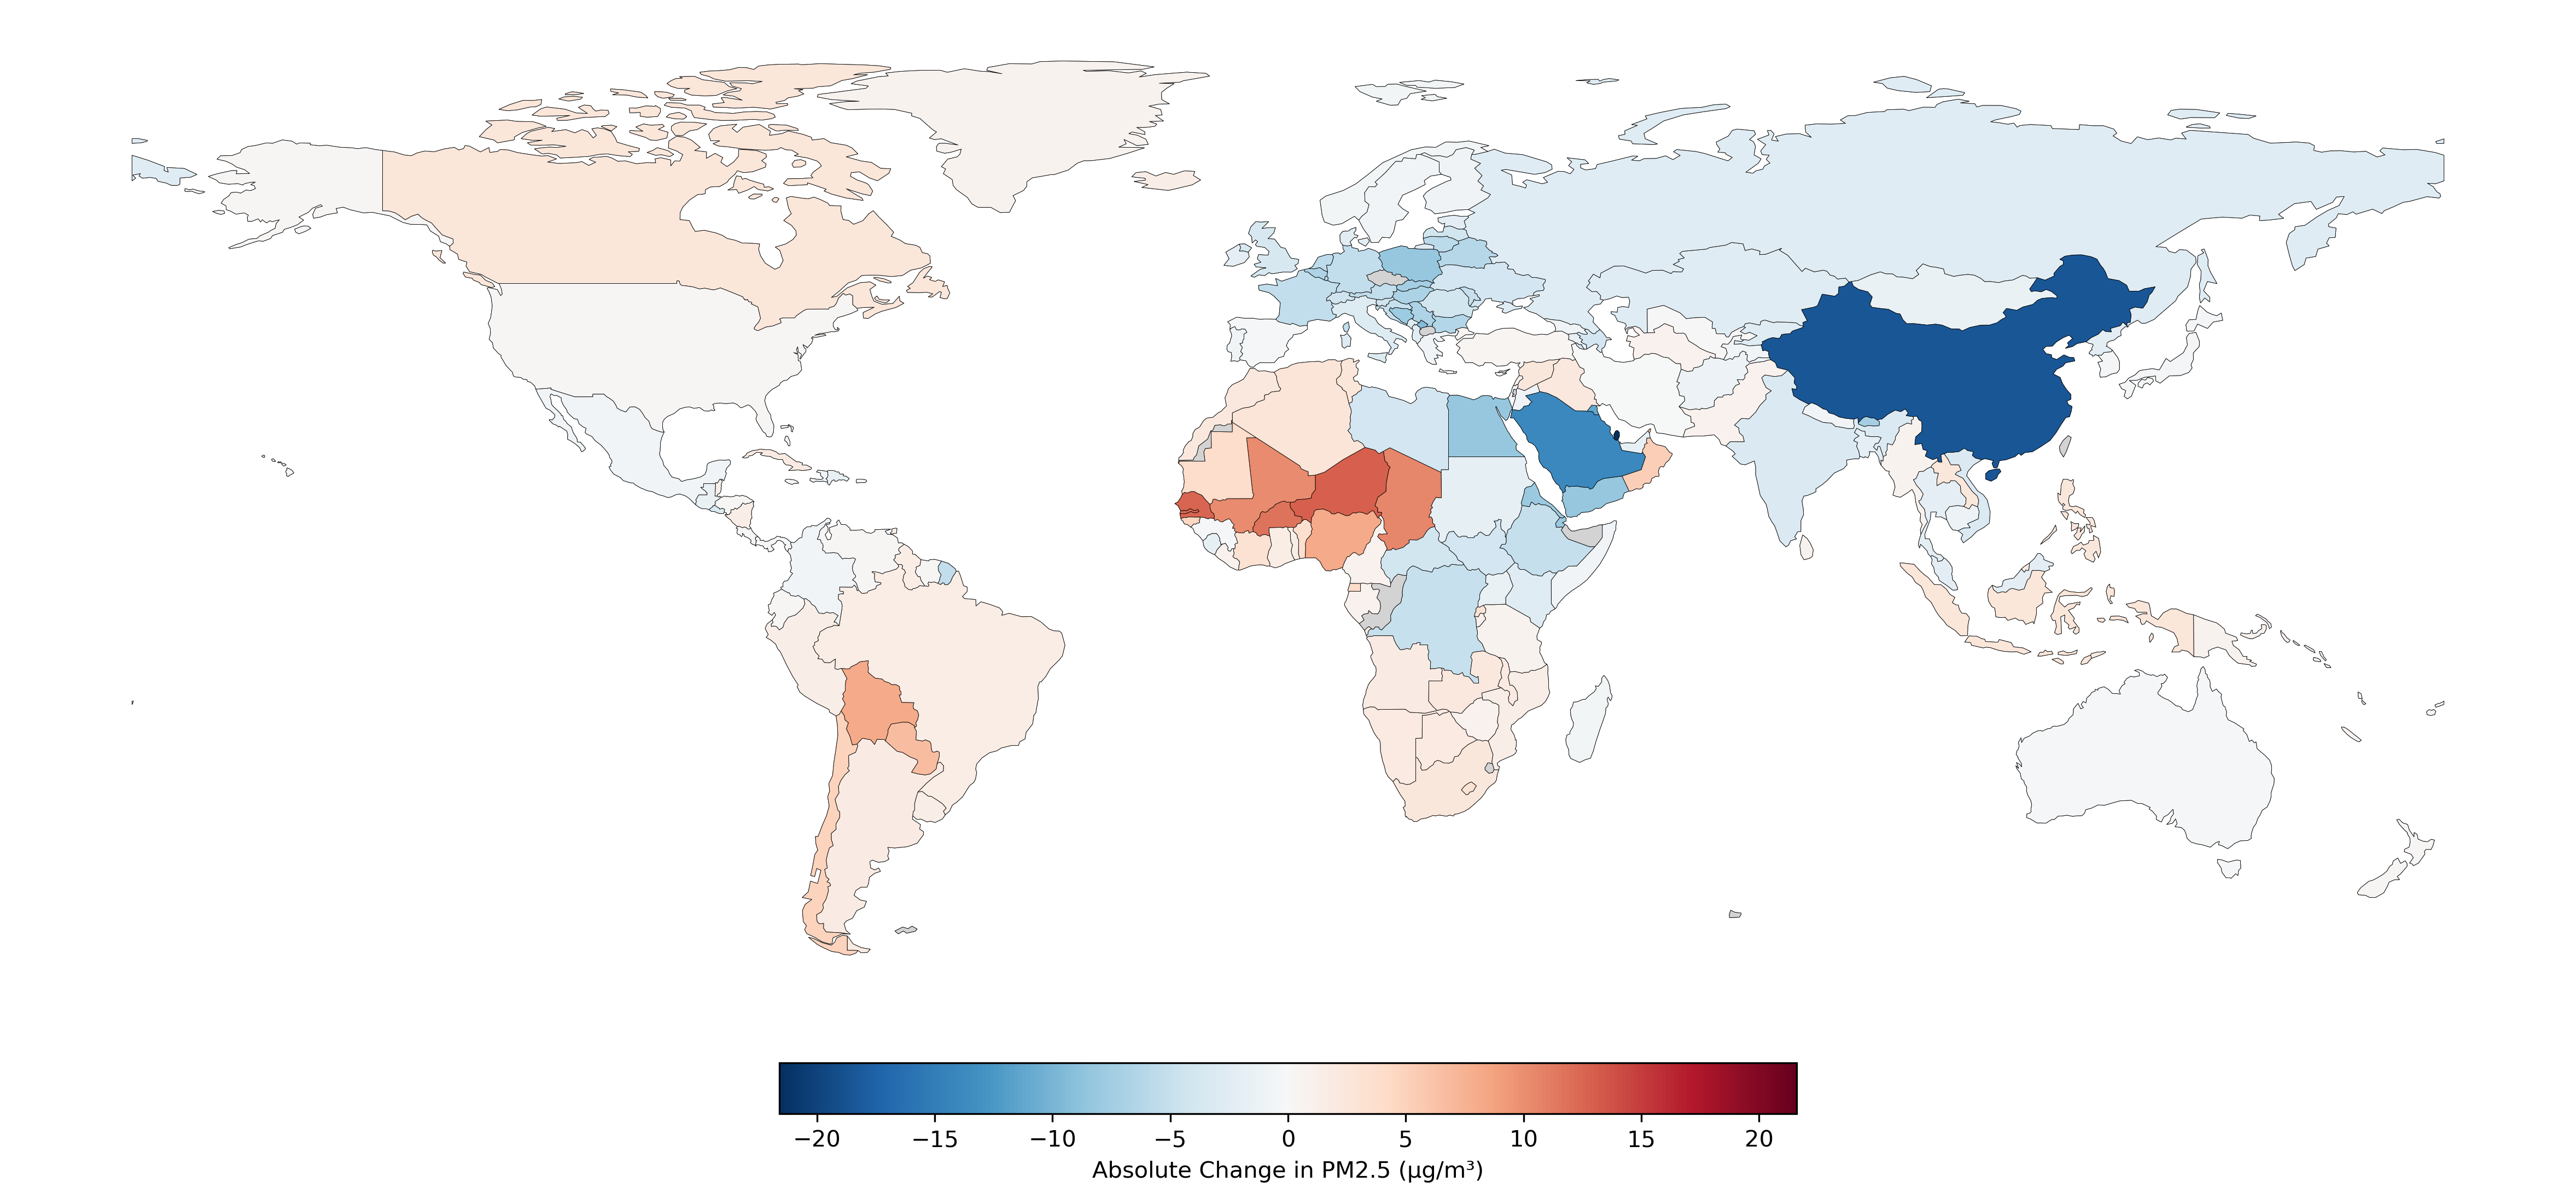
Source: Country-level satellite PM2.5 data compiled from Washington University in St. Louis (Shen et al. 2024)
Outdoor and Indoor Air Pollution
Ambient and household air pollution are distinct problems with overlapping sources. Over two billion people worldwide still rely on solid fuels – wood, dung, crop residues, and coal – for cooking and heating (International Energy Agency 2023). Indoor concentrations during cooking events can exceed ambient levels by an order of magnitude, and household air pollution causes approximately 3.2 million premature deaths per year and disproportionately affects women and children (Health Effects Institute 2025). Our focus in this review is largely on ambient air pollution and the policies that address it, but the two problems are not independent: household emissions contribute to ambient concentrations, and interventions targeting household energy (clean cookstoves, LPG distribution, electrification) improve both indoor and outdoor air quality.
Source Apportionment
Identifying polluters is a natural starting point for designing policy solutions. Most commonly, the pollutants of primary interest are those that contribute to fine particulate pollution, either directly (organic and black carbon) or indirectly (secondary particle formation from sulphates and nitrates). Fine particulate matter (PM2.5) dominates the air pollution health burden, but ground-level ozone also contributes materially to respiratory mortality and to crop yield losses (Malley et al. 2017). Ozone is formed through photochemical reactions involving NOx and volatile organic compounds, and many of the same sources that produce particulate precursors also contribute to ozone formation.
McDuffie et al. (2020) combine a global emissions inventory (the Community Emissions Data System, CEDS) and a chemical transport model to apportion global pollution to different fuels and/or sectors.[6] Figure 4 provides their results for a range of pollutants.
Figure 4: Sectoral contribution to different air pollutants (global averages) measured in Tg per year
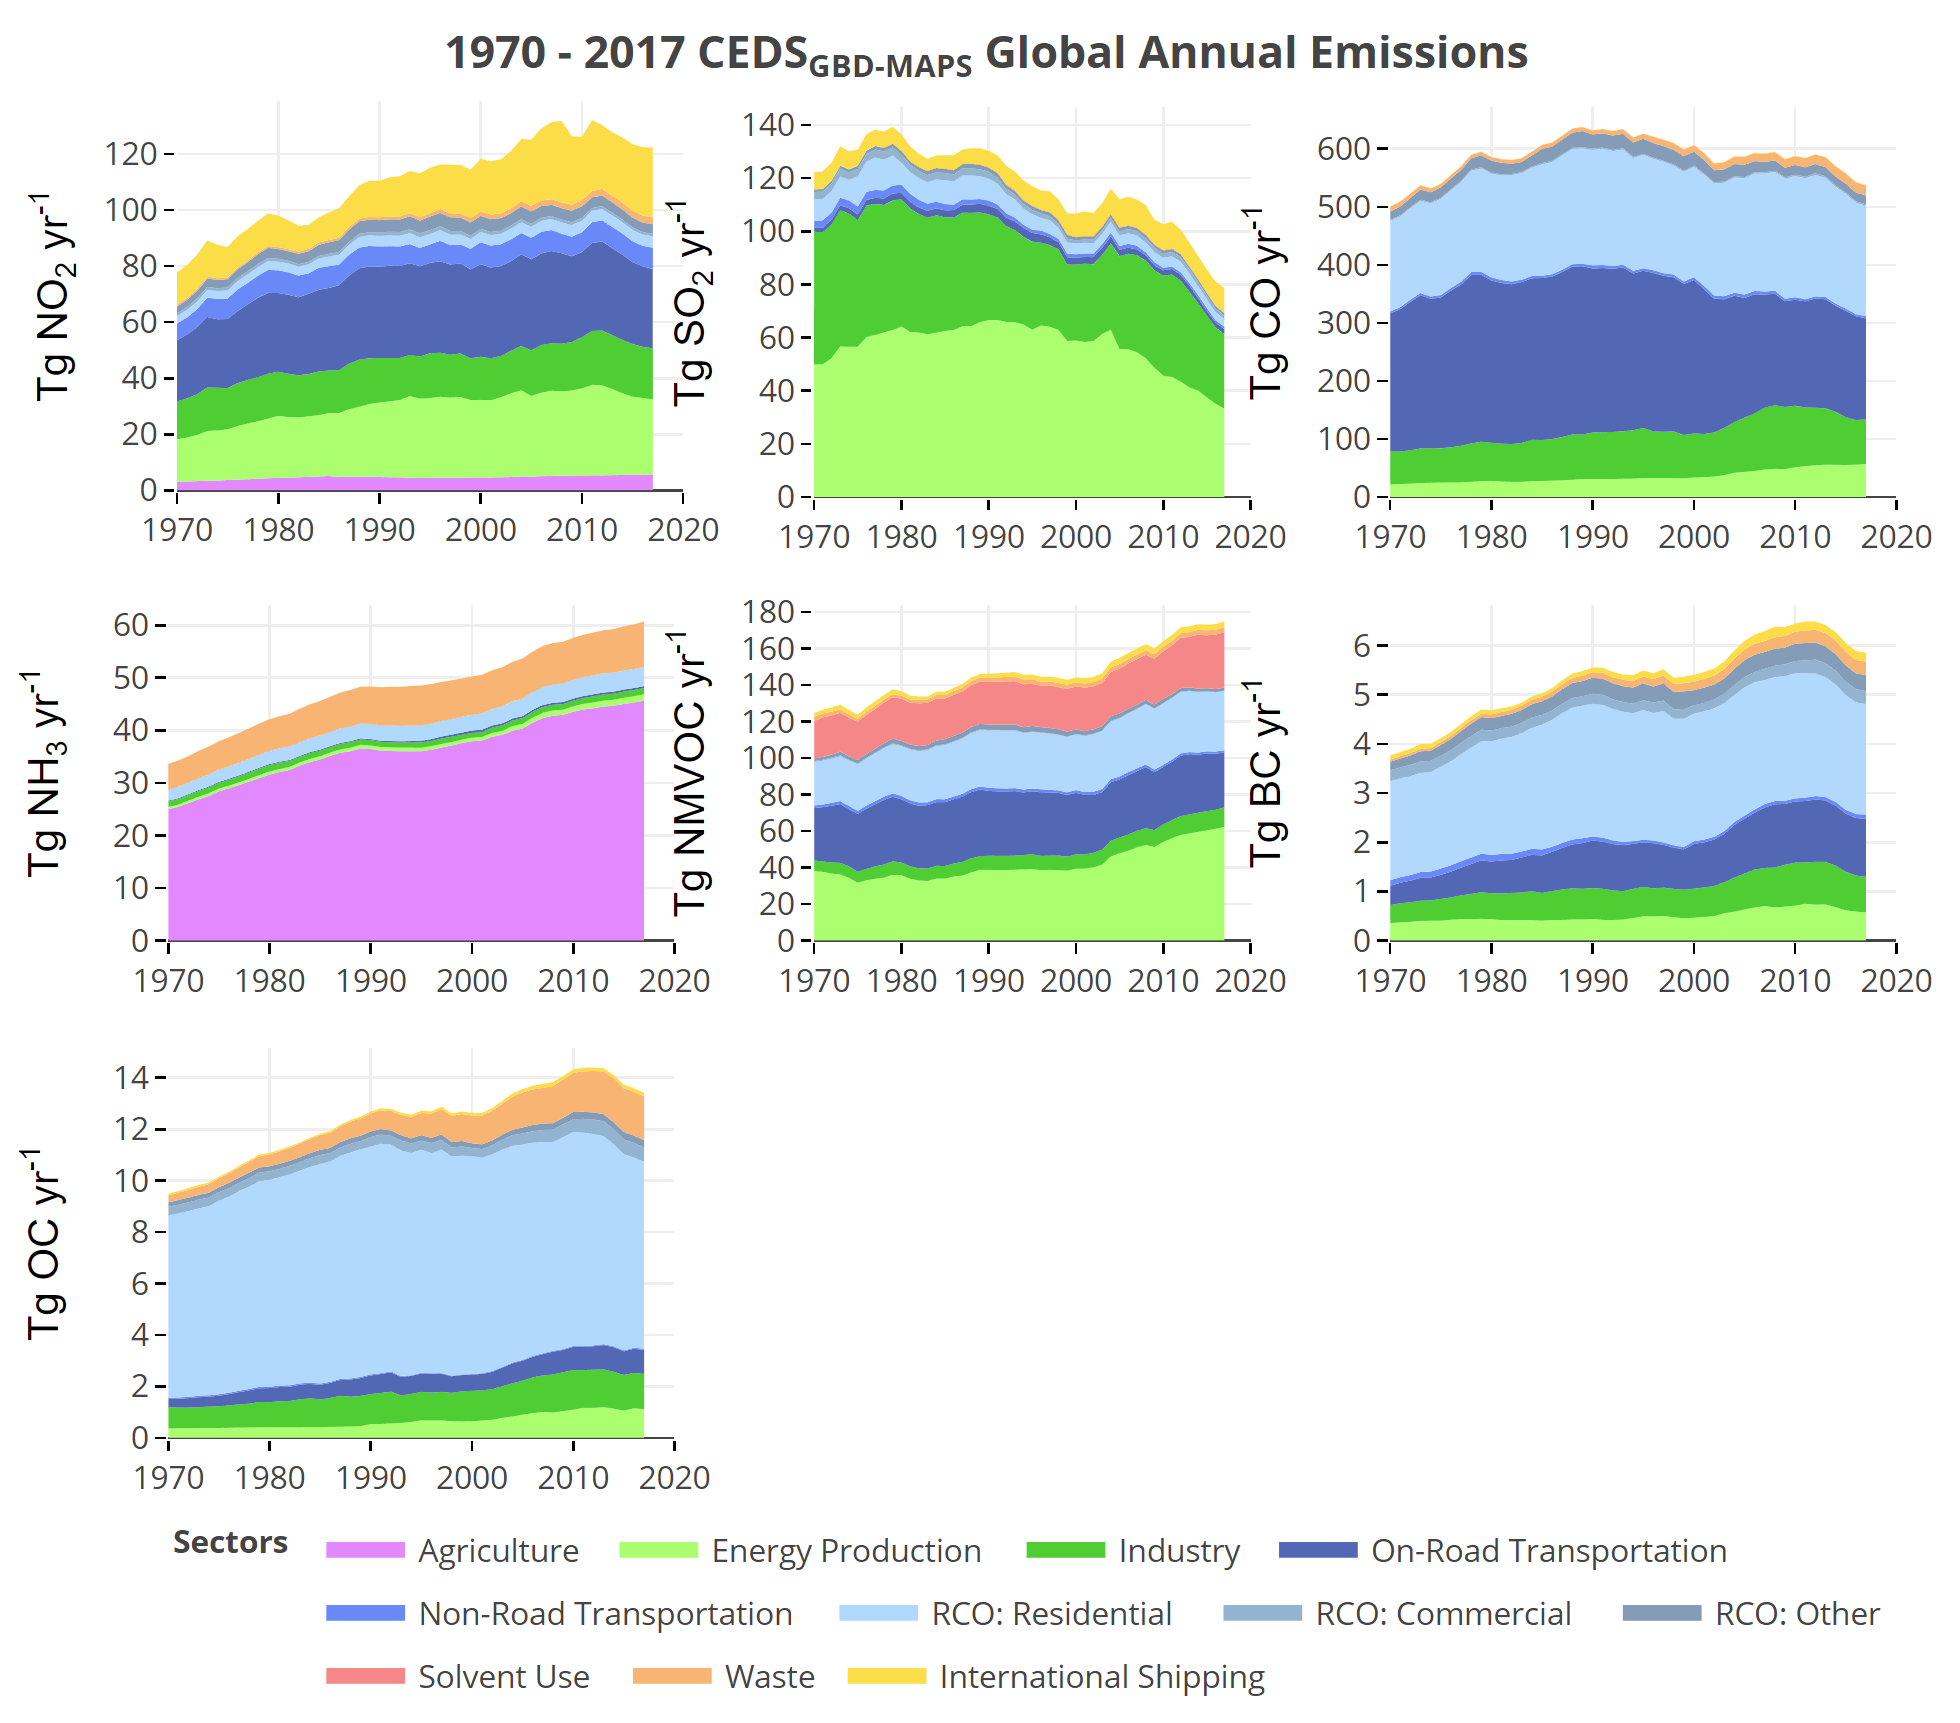
Source: McDuffie et al (2020)
The source apportionment for NO2, SO2, BC (black carbon), and OC (organic carbon) yields two conclusions. First, a large share of direct particulate emissions comes from the residential sector – largely from burning biomass or solid fuels to cook or stay warm. Second, outside of residential emissions, the remaining pollution is spread across transportation (especially for NO2), industry, and power generation (especially for SO2), with no single dominant culprit. Cleaning up the air will require a suite of different solutions.
Country-specific studies reach similar conclusions. Residential biomass is typically the cause of a minority – but a non-trivial minority – of fine particulate pollution. For example, Zhang et al. (2023) carry out an apportionment exercise over several cities in China. They find the single largest primary source of fine particles was residential biomass combustion with city-specific contributions comprising 18–25% of total emissions. Nevertheless, the majority of pollution could be attributed to vehicles and industry, in part because of their role in producing secondary particles that are formed as SOx and NOx emissions undergo chemical reactions in the air. In India, Chatterjee et al. (2023) find that about 28% of fine particulate emissions can be attributed to residential biomass. In Indonesia, Istiqomah and Marleni (2020) attribute about 18% of fine particles to residential biomass.
Pollution from burning biomass at home poses a very different type of problem to emissions from industry or transport. Rising incomes are likely to reduce the reliance of the rural and urban poor on dirty biomass. Although experience suggests the transition to gas or electricity for cooking may be painfully slow, this is nevertheless likely to be a shrinking pollution source as incomes grow. Residential biomass, about a fifth of the problem, fits most neatly into a Kuznets curve framework where removing poverty also reduces pollution.
Figure 5 uses data from McDuffie et al. (2020) to plot country-level histograms of the share of SO2, NO2, BC, and OC from different sources. In Figure 6, we reproduce a figure from Pai et al. (2022) to show the share of current air pollution that comes from anthropogenic sources.
Figure 5: Left column: Share of anthropogenic emissions by country from industry (IND), energy (ENE), road transport (ROAD), and non-road transport (NRTR). Right column: Share from residential combustion.
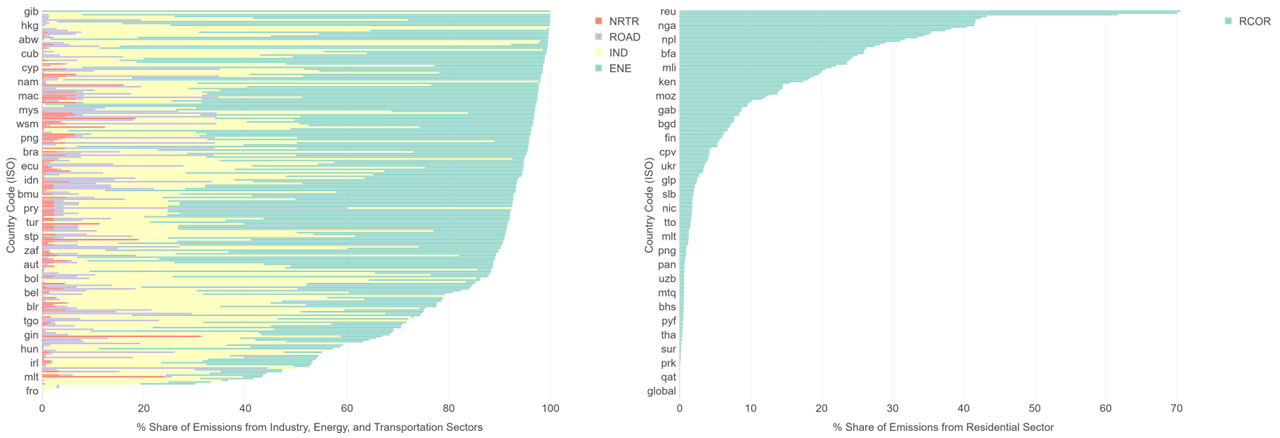
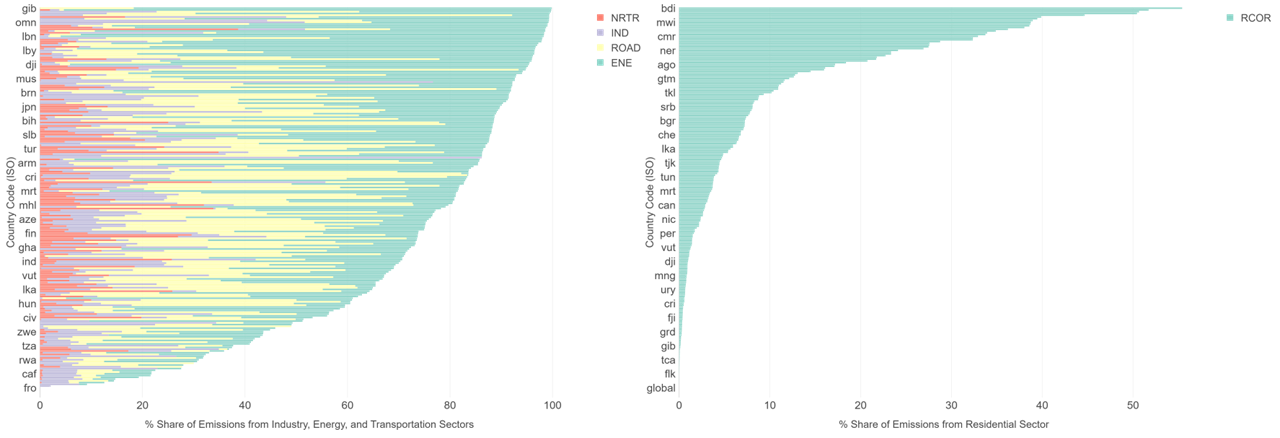
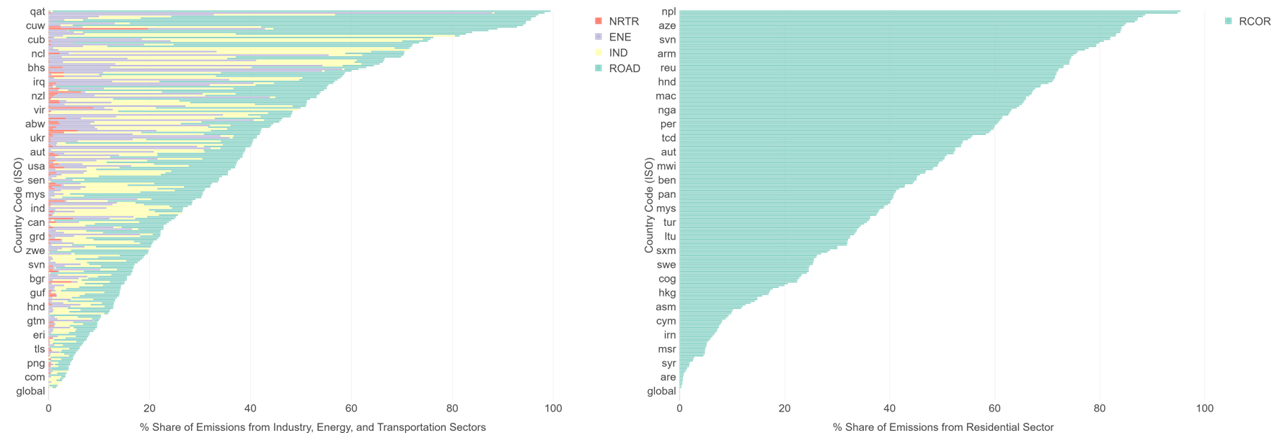
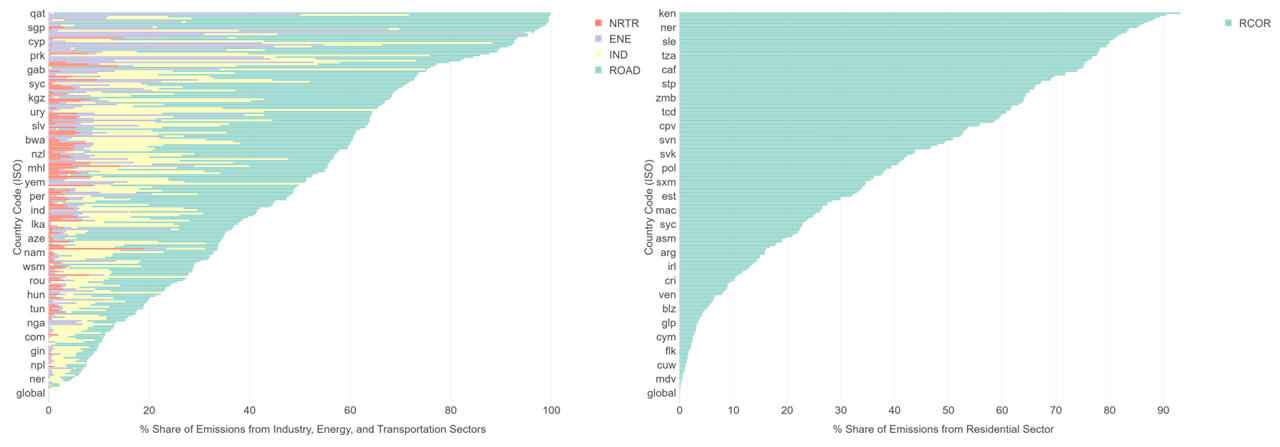
Source: McDuffie et al. (2020)
Figure 6: Compositional representation of population-weighted PM2.5 exposure for the modern day emission (ModernDay, MD) scenario and the extreme abatement (noAnthro, nA) scenario organised by continent
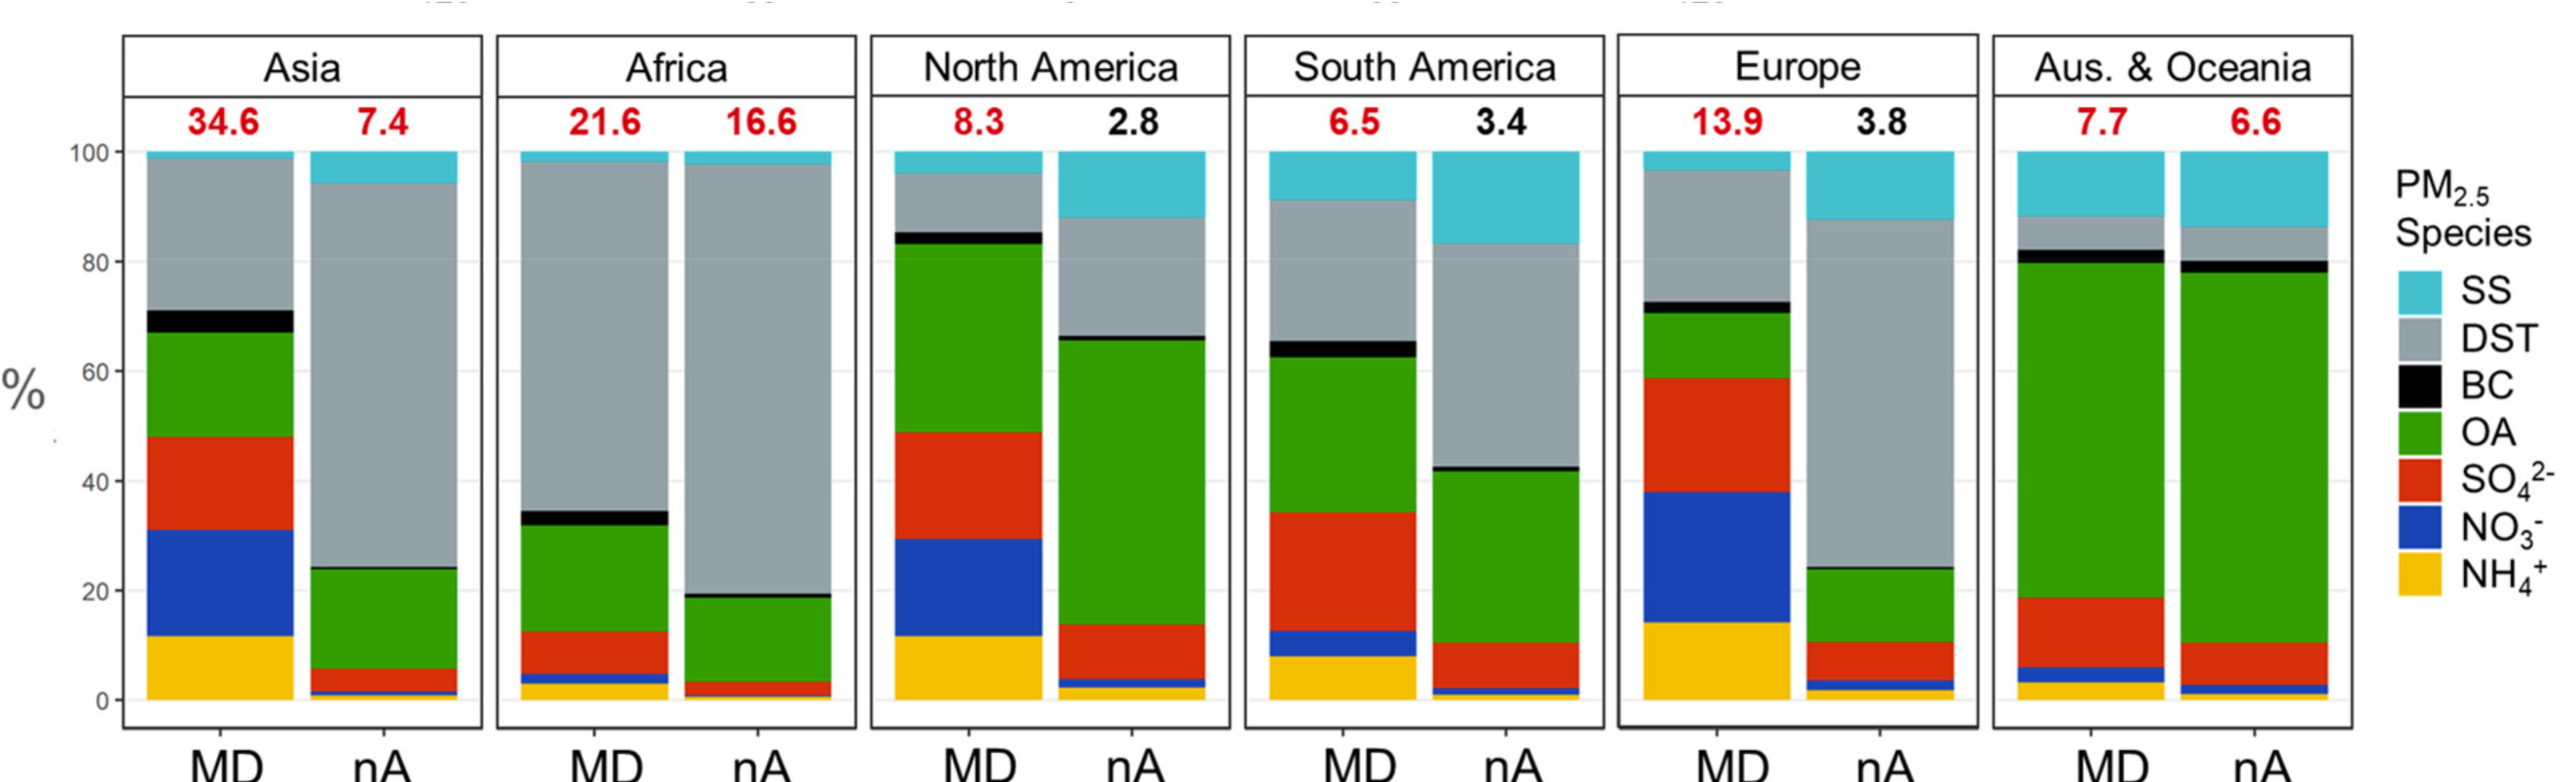
Notes: The numbers on top of each bar correspond to the population-weighted annual PM2.5 exposure for each continent (with levels that exceed the WHO guideline in red). Caption and image replicated from Pai et al. (2022), Figure 3.
We make three observations from these figures. First, industry and transport are important sources of sulphates and nitrates, both of which are components of fine particulate pollution. Second, the share of pollution from household biomass varies widely and is much more important for organic and black carbon (direct sources of fine particulates). Third, in most parts of the world anthropogenic sources are more important than natural sources. In Africa, current air pollution is mostly from natural sources, including sea salt and dust. Nevertheless, regardless of the baseline level of natural pollution, the key parameter in determining policy choices is the marginal benefit of lowering anthropogenic pollution.
In thinking about solutions, we could distinguish conceptually between the contribution of inferior energy choices that become less preferred as incomes rise (such as residential biomass), versus those that might become more popular (such as fossil fuels for manufacturing and power generation and liquid fuels for transportation). This review focuses on policies that might tackle the latter. However, we stress that the significant body of work on ways to speed the energy transition among the rural poor should also be viewed as contributing to ambient air quality solutions.
For full reference list see the end of the conclusion chapter.
Contact VoxDev
If you have questions, feedback, or would like more information about this article, please feel free to reach out to the VoxDev team. We’re here to help with any inquiries and to provide further insights on our research and content.