


A new adjusted and harmonised satellite nighttime-lights series for 1992–2023 tracks local development in the Global South more accurately than the off-the-shelf data – especially in panels and at fine spatial resolution.
Editor’s note: The authors have made their dataset publicly available here.
Satellite images of nighttime lights have become one of the most widely used data sources in development economics, political science, and remote sensing. They are attractive precisely where local statistics are weakest: low- and middle-income countries with limited state capacity, large informal sectors, and underfunded statistical agencies (Donaldson and Storeygard 2016, Henderson et al. 2012, Michalopoulos and Papaioannou 2018). Luminosity has been used to correct inflated output statistics produced by non-democratic regimes (Martinez 2022), estimate regional and ethnic inequality (Alesina et al. 2016), quantify the growth of cities (Storeygard 2016), and assess the role of precolonial and national institutions across historical ethnic homelands (Michalopoulos and Papaioannou 2013, 2014).
Despite this popularity, important concerns remain. How well do lights capture development at fine spatial resolution in poor, sparsely lit regions where most pixels are dark? Does the correlation hold not just across locations but also over time, as conditions change? And can the lower-resolution pre-2013 DMSP series be reconciled with the much higher-quality VIIRS series introduced in 2013, so that researchers can study three decades of economic change in a single, comparable panel? Recent evidence is mixed. Data from India suggests that lights proxy local conditions well in both levels and changes (Asher et al. 2021). Evidence from Indonesia, China, and South Africa suggests much weaker tracking outside cities, at least in the early period (Gibson et al. 2021). Other studies find strong cross-sectional but weak dynamic associations (Chen et al. 2024).
In recent research (Chiovelli, Michalopoulos, Papaioannou, and Regan 2025), we tackle these issues head-on. We compile a standardised global annual nighttime-lights series at 30 arc-seconds for 1992–2023, integrating the pre-2013 DMSP and post-2013 VIIRS satellite systems with explicit corrections for the three features that most distort the raw data: cross-sensor calibration, top-coding, and blooming. We then validate the new series as a proxy for local development across low-income settings in Africa, Mozambique, Indonesia, and India.
Three problems with the raw DMSP series
The DMSP-OLS data that underpins most of the pre-2013 evidence has three main deficiencies. First, the series comes from six satellites whose sensors differ and degrade over time, so raw luminosity values are not directly comparable across years. Second, DMSP stores each pixel as an 8-bit integer bounded at 63, so bright city centres are top-coded. Third, the sensor has weak spatial accuracy, so light ‘blooms’ from lit pixels to their darker neighbours, inflating the apparent footprint of towns and hiding variation between them.
We apply corrections for each. Cross-sensor inter-calibration follows Li and Zhou (2017); top-coding is fixed using a truncated-Pareto method (Bluhm and Krause 2022); and blooming is removed by modelling each pixel’s light as a spatial spillover from its neighbours (Cao et al. 2019). Most African pixels are unlit (98% in 1992, 97% in 2012), so the blooming correction tends to matter more than the top-coding one.
Bridging two satellite eras with machine learning
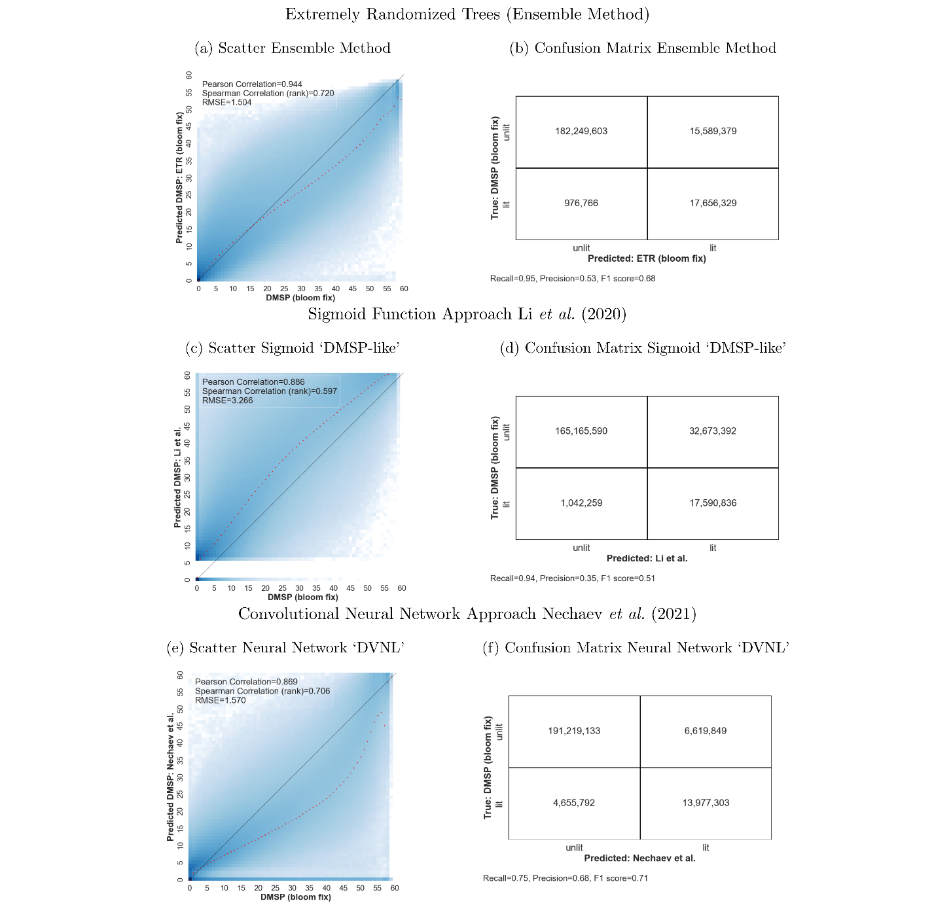
Harmonising DMSP with VIIRS is not straightforward. VIIRS is recorded at a finer spatial resolution, stores a much wider range of values, and has a cleaner sensor. Our strategy is to ‘downgrade’ VIIRS onto the adjusted DMSP scale using an ensemble machine-learning model – an extremely randomised trees algorithm, which builds many decision trees and averages their predictions (Geurts et al. 2006). We train it on the single full year of overlap (2013) with features that combine pixel statistics, neighbourhood statistics at many window sizes, and broad world-region indicators.
The payoff is substantial. On a held-out 2013 test set, our model delivers an out-of-sample RMSE of 1.5, compared with 3.27 for the sigmoid approach of Li et al. (2020) and 1.57 for the neural-network approach of Nechaev et al. (2021) – and it performs particularly well in the low-light range relevant for the Global South. At the extensive margin, the F1 score is 0.68, against 0.51 and 0.71 for the alternatives. The result is a single luminosity series that spans 1992–2023 without a visible discontinuity at 2012–2013.
Figure 1: Out-of-sample performance of the ensemble method versus existing DMSP–VIIRS harmonisations
Does it track local development? Evidence from 34 African countries
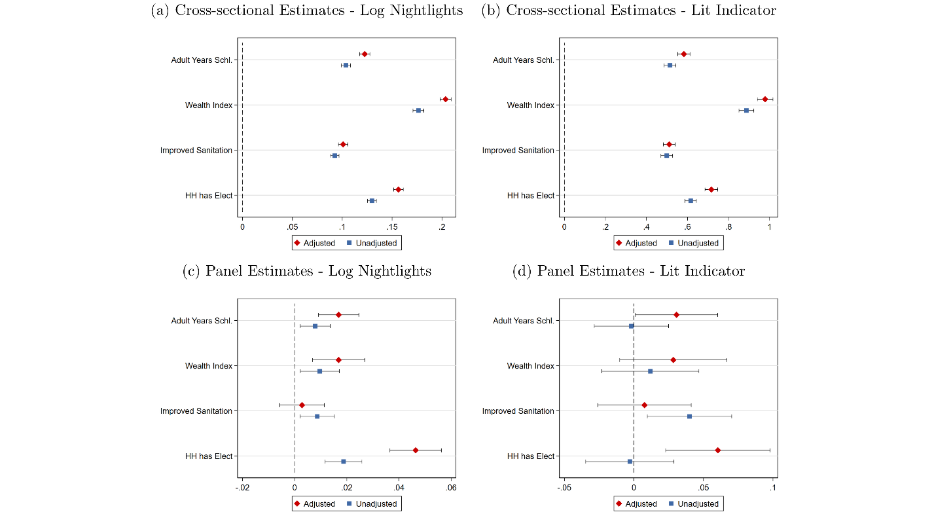
We next ask whether the new series does a better job than off-the-shelf data of tracking local well-being. We overlay the harmonised lights on 139 geo-referenced Demographic and Health Surveys from 34 African countries, aggregated to 28 km grid cells, and regress four development indicators – years of schooling, the DHS composite wealth index, access to improved sanitation, and a household electricity indicator – on log luminosity.
Across all four outcomes, the adjusted series correlates more strongly with development than the unadjusted one, both in cross-sectional and panel specifications. The gains are largest at the extensive margin (lit versus unlit) and in panel specifications that exploit changes over time – precisely the configurations in which measurement error is most damaging. When a grid cell turns lit with the adjusted series, for instance, household wealth and electricity access rise by roughly 0.05 standard deviations on average. The same transitions in the unadjusted data yield estimates indistinguishable from zero. Most of the improvement comes from the blooming correction; top-coding matters less because so few African pixels are bright enough to be top-coded. We should stress, however, that even the adjusted and harmonised series do contain noise and are by no means perfect proxies of well-being.
Figure 2: Correlations between DHS development proxies and luminosity, adjusted vs unadjusted series
Zooming in: Mozambique, Indonesia, and India
The African results extend to three country studies. In Mozambique, we digitise the full post-war censuses of 1997, 2007, and 2017 – linking luminosity to years of schooling and non-agricultural employment across 1,126 fourth-level administrative units. Localities turning lit have roughly half a year more schooling and 10 percentage points more non-agricultural employment, even after controlling for third-level administrative unit fixed effects that absorb very localised trends. In Indonesia, we link the harmonised lights to the village-level PODES survey with various public goods provision measures for more than 60,000 villages. The adjusted series outperforms the unadjusted one almost uniformly across public-goods measures – schools, health facilities, water and sanitation access, paved roads. In India, drawing on the SHRUG dataset covering over 550,000 villages and towns, the adjusted series tracks population and non-farm, manufacturing, and services employment more reliably than the unadjusted data, especially at the village (rural) level.
Revisiting three influential studies
To show what this means for research, we replicate three influential studies. The finding that precolonial political centralisation correlates with contemporary local development in the ancestral homelands of African ethnic groups (Michalopoulos and Papaioannou 2013) holds with similar strength using the adjusted series. This is unsurprising, as country-ethnic homelands average 25,000 square kilometres and the noise of the unadjusted series averages out. The within-ethnicity correlation between national institutions and local development across partitioned ethnic groups (Michalopoulos and Papaioannou 2014) is somewhat sharper with the adjusted series, with the ‘near-capital’ effect in particular becoming more precisely estimated. The evidence for regional favouritism by national leaders (Hodler and Raschky 2014) also strengthens: the coefficient on a leader’s home district more than doubles in some specifications and is always more precisely estimated with the adjusted series. Adjustments matter most where designs exploit within-unit, over-time variation – precisely where measurement error of the original (‘raw’) series is worst.
Implications for applied research
Three practical takeaways follow. First, our harmonised series is designed for research that needs data from the 1992–2023 period; for analyses confined to post-2013 years, researchers should use VIIRS directly, since downgrading it to the DMSP scale sacrifices quality. Second, when the longer horizon is needed, the design matters: in cross-country or coarse-subnational works, the adjustment makes little difference – noise averages out – but in within-country, panel, or high-resolution designs it meaningfully reduces measurement error and can overturn null findings. Third, the dataset and replication code are open-source (see here), so the adjustments can be reproduced, customised, or extended. We will also continue to extend the harmonised series as new nightlight data becomes available.
Nighttime lights are not a panacea: correlations with local well-being, while strong, remain far from perfect, and ways to combine them with daytime imagery and structural-economic models are developing quickly (Jean et al. 2016, Yeh et al. 2020, Rossi-Hansberg and Zhang 2025, Proctor et al. 2023, Rambachan et al. 2025). But a comparable three-decade panel, anchored on the higher-quality VIIRS sensor, should make satellite-based research on the Global South more credible, more reproducible, and more useful for policy.
References
Alesina, A, S Michalopoulos, and E Papaioannou (2016), "Ethnic inequality," Journal of Political Economy, 124(2): 428–488.
Asher, S, T Lunt, R Matsuura, and P Novosad (2021), "Development research at high geographic resolution: An analysis of night lights, firms, and poverty in India using the SHRUG open data platform," World Bank Economic Review, 35(4).
Bluhm, R, and M Krause (2022), "Top lights: Bright cities and their contribution to economic development," Journal of Development Economics, 157.
Cao, X, Y Hu, X Zhu, F Shi, L Zhuo, and J Chen (2019), "A simple self-adjusting model for correcting the blooming effects in DMSP-OLS nighttime light images," Remote Sensing of Environment, 224: 401–411.
Chen, Y, U Ursavaş, and C Mendez (2024), "Can higher-quality nighttime lights predict sectoral GDP across subnational regions? Urban and rural luminosity across provinces in Türkiye," Letters in Spatial and Resource Sciences, 17(12).
Chiovelli, G, S Michalopoulos, E Papaioannou, and T Regan (2025), "Illuminating the Global South," The Economic Journal, Forthcoming.
Donaldson, D, and A Storeygard (2016), "The view from above: Applications of satellite data in economics," Journal of Economic Perspectives, 30(4): 171–198.
Geurts, P, D Ernst, and L Wehenkel (2006), "Extremely randomized trees," Machine Learning, 63: 3–42.
Gibson, J, S Olivia, G Boe-Gibson, and C Li (2021), "Which night lights data should we use in economics, and where?," Journal of Development Economics, 149.
Henderson, J V, A Storeygard, and D N Weil (2012), "Measuring economic growth from outer space," American Economic Review, 102(2): 994–1028.
Hodler, R, and P Raschky (2014), "Regional favouritism," Quarterly Journal of Economics, 129(2): 995–1023.
Jean, N, M Burke, M Xie, W M Davis, D B Lobell, and S Ermon (2016), "Combining satellite imagery and machine learning to predict poverty," Science, 353(6301): 790–794.
Li, X, and Y Zhou (2017), "A stepwise calibration of global DMSP/OLS stable nighttime light data (1992–2013)," Remote Sensing, 9(6).
Li, X, Y Zhou, M Zhao, and X Zhao (2020), "A harmonized global nighttime light dataset 1992–2018," Nature: Scientific Data, 7(168).
Martinez, L (2022), "How much should we trust the dictator’s GDP growth estimates?," Journal of Political Economy, 130(10): 2731–2769.
Michalopoulos, S, and E Papaioannou (2013), "Pre-colonial ethnic institutions and contemporary African development," Econometrica, 81(1): 113–152.
Michalopoulos, S, and E Papaioannou (2014), "National institutions and sub-national development in Africa," Quarterly Journal of Economics, 129(1): 151–213.
Michalopoulos, S, and E Papaioannou (2018), "Spatial patterns of development: A meso approach," Annual Review of Economics, 10: 383–410.
Nechaev, D, M Zhizhin, A Poyda, T Ghosh, F C Hsu, and C Elvidge (2021), "Cross-sensor nighttime lights image calibration for DMSP/OLS and SNPP/VIIRS with residual U-Net," Remote Sensing, 13(24).
Proctor, J, T Carleton, and S Sum (2023), "Parameter recovery using remotely sensed variables," Unpublished manuscript.
Rambachan, A, R Singh, and D Viviano (2025), "Program evaluation with remotely sensed outcomes," Unpublished manuscript.
Rossi-Hansberg, E, and J Zhang (2025), "Local GDP estimates around the world," Unpublished manuscript.
Storeygard, A (2016), "Farther on down the road: Transport costs, trade and urban growth," Review of Economic Studies, 83(3): 1263–1295.
Yeh, C, A Perez, A Driscoll, G Azzari, Z Tang, D Lobell, S Ermon, and M Burke (2020), "Using publicly available satellite imagery and deep learning to understand economic well-being in Africa," Nature Communications, 11(2583).