


Evidence shows that satellite data is a useful tool for tracking improvements in infrastructure access and service delivery in rural areas
Tracking infrastructure and service delivery in developing countries can be challenging (Olken 2005, Rasul and Rogger 2016).1 In recent years, African countries have allocated about 3.4% of GDP to infrastructure projects, with one-third of these budgets funded by foreign aid. Yet, accurately measuring the physical installation and quality of water and sewage infrastructure, or connections to the power grid, has been an ongoing challenge for governments, development banks, and NGOs trying to understand where money is going. Additionally, measurement challenges do not disappear once infrastructure is built. Ongoing service delivery often requires infrastructure maintenance, and hence continued monitoring.
Can satellite data be useful here?
In a new working paper (Machemedze et al. 2017), we explore whether night-time luminosity, or ‘nightlights’ measured by satellite data, offers a useful tool to policymakers needing to track infrastructure delivery. Different types of satellite data will be more useful for different types of infrastructure. In our case, we use nightlights to measure changing access to electricity.2
Many development agencies, NGOs, and national governments are investing in power transmission and distribution infrastructure in Africa, the continent with the lowest overall access to electricity (World Bank 2017a). To make meaningful progress in connecting households to power sources in the next five years, an estimated $4 billion will be needed. Given the size of these budgets, having a reliable way to track actual service delivery is important for minimising wasteful leakages from public expenditures.
It might seem obvious that we should be able to ‘see’ new electricity connections at the household level using satellite data on nightlights, especially in places with initially zero or low levels of connectivity. To be useful for policy, however, we also need to know how changes in the number of households connected translate into changes in the night-time luminosity measure. Our paper provides an initial calibration of this relationship by matching nightlight data to a 20-year panel survey of household electricity connections in rural South Africa. We find promise in using this high-level approach to measuring infrastructure delivery targets even at a very granular level.
The South African context: Large increases in subsidised electricity connections in the 1990s
Over 90% of households in South Africa currently have a grid connection to electricity, the highest rate of access on the continent. This is a direct result of state-sponsored programmes of rural electrification in the 1990s and 2000s which provided free and heavily subsidised grid connections to over seven million households in mostly rural areas, rapidly transforming access for the 70% of households still unconnected by the mid-1990s.3 We use this context to measure the link between the number of new households connected, and nightlights as measured by satellite data, in a rural North Eastern part of the country, namely, Bushbuckridge. This area resembles other remote rural areas of South Africa with a reasonably high population density, high levels of poverty, and large infrastructure deficits in the mid-1990s.
Calibrating the nightlights-electrification relationship using household survey data
Our data are from a long-running demographic surveillance site, the Agincourt Health and Demographic Surveillance Site (AHDSS), based in Bushbuckridge. We use a 20-year panel dataset of over 11,000 households in 32 villages.4 In the second decade of the study, the survey measures direct connections to the power grid. By linking the household survey data to nightlights data (taken from the DMSP-OLS Night-timeLights Time Series), we can ask whether changes in the number of households reporting a connection to the grid show up in the nightlights data, over space and time.
Building a pixel-level dataset (one pixel is roughly one square kilometre), we count the number of households connected per pixel and year using the survey data, and create average night-time luminosity (sum of lights, or SOL) per pixel and year.5 Figure 1 shows the evolution of the SOL measure for the study area between 1992 and 2007. Over time, the map becomes progressively ‘lighter’.
Figure 1 Sum of lights (SOL) measure for Agincourt over time
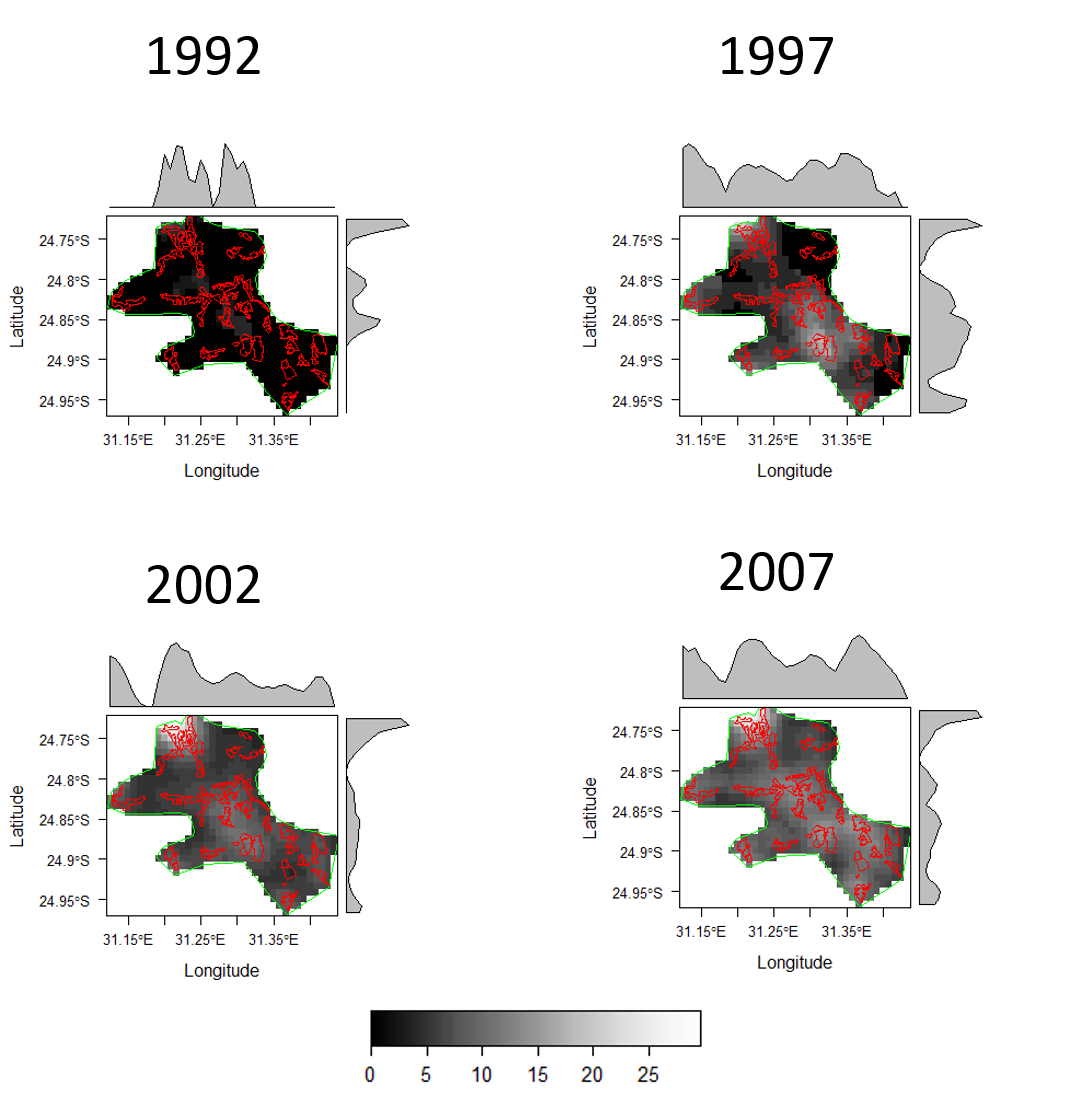
Note: Red outlines identify villages that are surveyed in the data.
We relate the SOL per pixel to the number of household grid connections per pixel, controlling for year and village fixed effects. Our main finding is that for 50 additional household connections in a one square kilometre area, the SOL increases by 0.35 units. This is a 5% increase on baseline levels of brightness for the Agincourt area.
This calibrated relationship between household connections and night-time luminosity is broadly useful for policy. It means that in other parts of rural South Africa with similar population density and baseline levels of nightlights, infrastructure spending that connects 50 more households should show up as an increase of 0.35 in night-time luminosity.
Satellite data also reveal service delivery reversals
In addition to the SOL measure tracking actual new connections to the grid, the satellite data also reveal significant declines in service delivery in the later part of the period. Figure 2 shows the SOL measure for the Agincourt/Bushbuckridge area, alongside the same measure for Kruger park (a national park without significant human settlements) and for nearby Nelspruit, a large urban area.
Figure 2 Average sum of lights measure by year and place
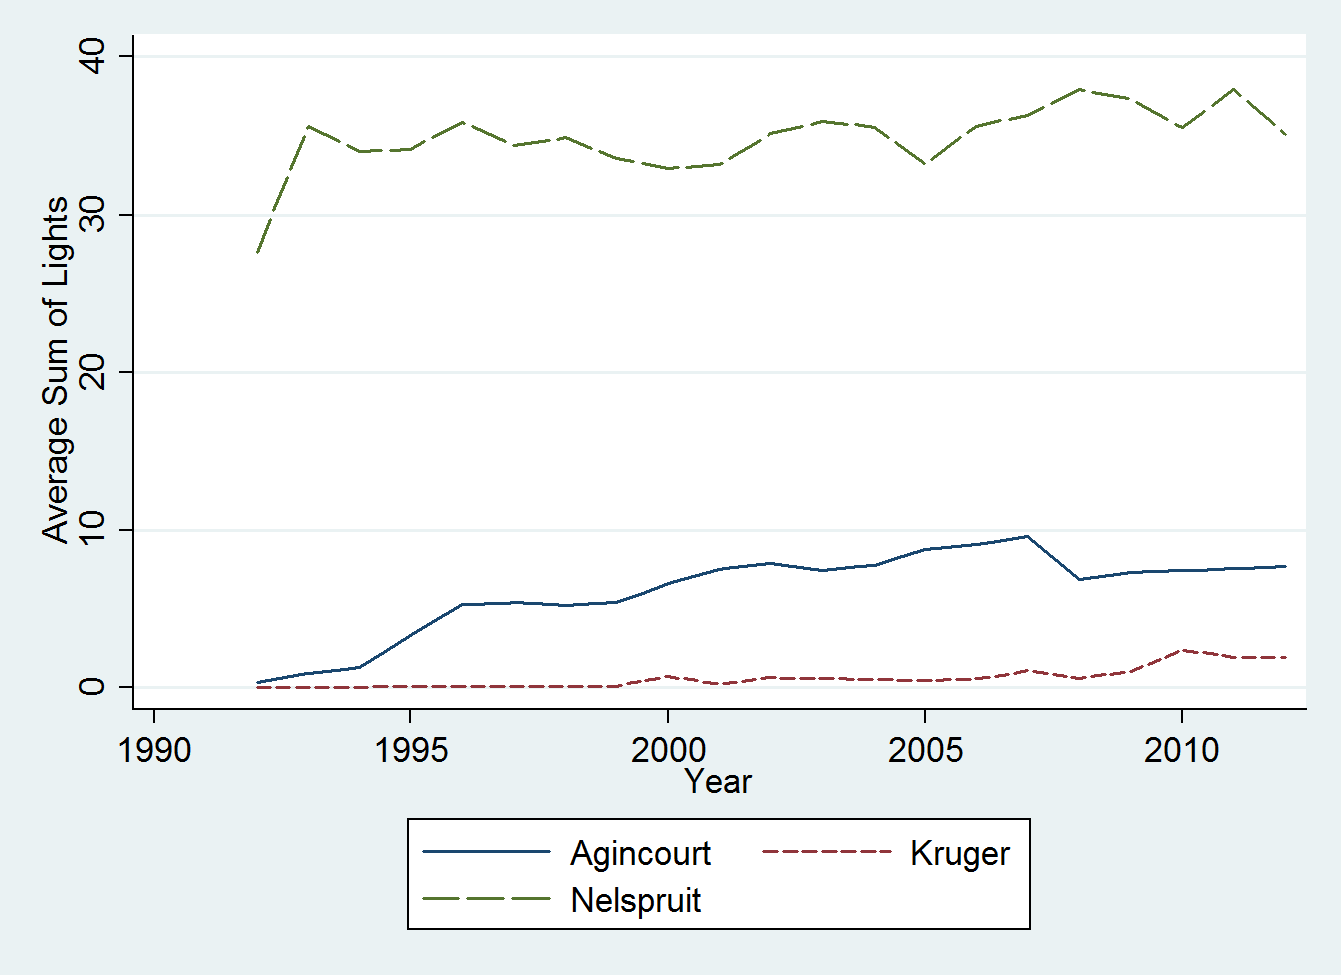
Around 2008, we observe a dip in luminosity in the Bushbuckridge area, which lines up with the period of massive load shedding (the deliberate shutdown of electric power in a part or parts of a power-distribution system, generally to prevent the failure of the entire system when the demand strains the capacity of the system) in South Africa. We see no similar dip in Kruger, where there is almost no electrification, or in Nelspruit, which is a large urban area and the capital city in the province that was largely insulated from load shedding.
What we learn from this is that although households in the Bushbuckridge area had been connected in early programmes of electrification rollout, access to the power grid was not a once-and-for-all occurrence. Supply-side constraints meant that service delivery went backwards, and this reversal shows up in the nightlights data.6
Conclusions
Satellite data can be used as one type of third-party measurement to track the ramping up of electricity connections in developing countries, and for diagnosing when service delivery, conditional on connections, is worsening. For areas similar to our study site – remote rural areas with poor infrastructure provision and high levels of poverty – we calibrate that each additional 50 households connected can be measured as an observable increase in night-time luminosity of 0.35 units. This relationship could be used to track the expansion and performance of the electricity grid in areas where utilities are known to be investing. Other types of satellite data may also be useful for monitoring road infrastructure projects that typically absorb the lion’s share (two-thirds) of public capital spending in African countries (World Bank 2017b).
There are two main drawbacks of using satellite data for tracking infrastructure delivery. First, such data may only be available to policymakers with some time lag. Second, to use satellite data effectively, researchers require technical skills suited to processing spatial data and they need initial household survey data to perform a calibration exercise in each country. On the plus side, compared with household survey data, satellite data provide maximal spatial coverage and the ability to measure changes in access exactly where infrastructure projects are happening. Compared with census data, satellite data provide higher frequency measurement of infrastructure project outcomes. Perhaps most usefully, nightlights data are not subject to the same incentive problems in reporting experienced by utilities and service providers.
References
Dinkelman, T (2011),"The effects of rural electrification on employment: New evidence from South Africa", American Economic Review 101(7): 3078-3108.
Donaldson, D and A Storeygard (2016), “The view from above: Applications of satellite data in economics”, Journal of Economic Perspectives 30(4): 171-198.
Harris, T, M Collinson and M Wittenberg (2017), “Aiming for a moving target: The dynamics of household electricity connections in a developing context”, World Development 97: 14-26.
Kahn K, S Tollman, M Collinson, SClark, R Twine, B Clark, M Shabangu, F Gomez-Olive, O Mokoenaand M Garenne(2007),“Research into health, population, and social transitions in rural South Africa: Data and methods of the Agincourt Health and Demographic Surveillance System”, Scandinavian Journal of Public Health 35(69): 8-20.
Machemedze, T, T Dinkelman, M Collinson, W Twine and M Wittenberg (2017), “Throwing light on rural development: Using nightlight data to map rural electrification in South Africa”, DataFirst Technical Paper 38.
Olken, B (2007), "Monitoring corruption: Evidence from a field experiment in Indonesia", Journal of Political Economy 115(2): 200-249.
Rasul, I and D Rogger (2016), “Management of bureaucrats and public service delivery: Evidence from the Nigerian civil service”, The Economic Journal 128(608): 413-446.
World Bank Group (2017a), Linking Up: Public-Private Partnerships in power transmission in Africa, World Bank, Washington.
World Bank Group (2017b), Africa’s Pulse No. 15, April.
Endnotes
[1] For example, Rasul and Rogger (2016) had to hand-code 4,700 engineering assessments of infrastructure project to study project completion rates in Nigeria.
[2] Economists have recently started to exploit satellite data for measuring human settlements, electricity access, and aggregate measures of wealth (Donaldson and Storeygard 2016).
[3] Dinkelman (2011) reviews this process and analyses labour market impact of the early part of this electrification episode.
[4] The sample has grown over time; see Kahn et al. (2007) for a description of the study.
[5] The maximum SOLmeasured in a given pixel in any year is 63, the minimum is 0. This reflects the fact that the Bushbuckridge area had a large service backlog in the mid-1990s.
[6] Harris et al. (2017) use different household survey data to measure actual disconnections from the electricity grid over time, presumably for non-payment of bills. We are investigating whether these disconnections also show up in the night-time lights measures.