


Mines pollute their surroundings, including water flows. In Africa, new evidence shows that plants and crops are less healthy downstream of mining sites, with the largest impacts in fertile, densely vegetated areas and regions dominated by gold mining.
The mining sector in Africa is expanding rapidly, partly driven by the mineral demand of the clean energy transition (Pörtner et al. 2022). While mines provide important goods and may spur local economic development, they also produce pollution that can be detrimental to their surroundings (Girard et al. 2025). These externalities are particularly problematic when regulation to manage them is weak. In recent work (Vashold, Pirich, Heinze, and Kuschnig 2026), we focus on mining-induced water pollution and find that vegetation is less healthy where this water travels. This results in a considerable loss of agricultural production.
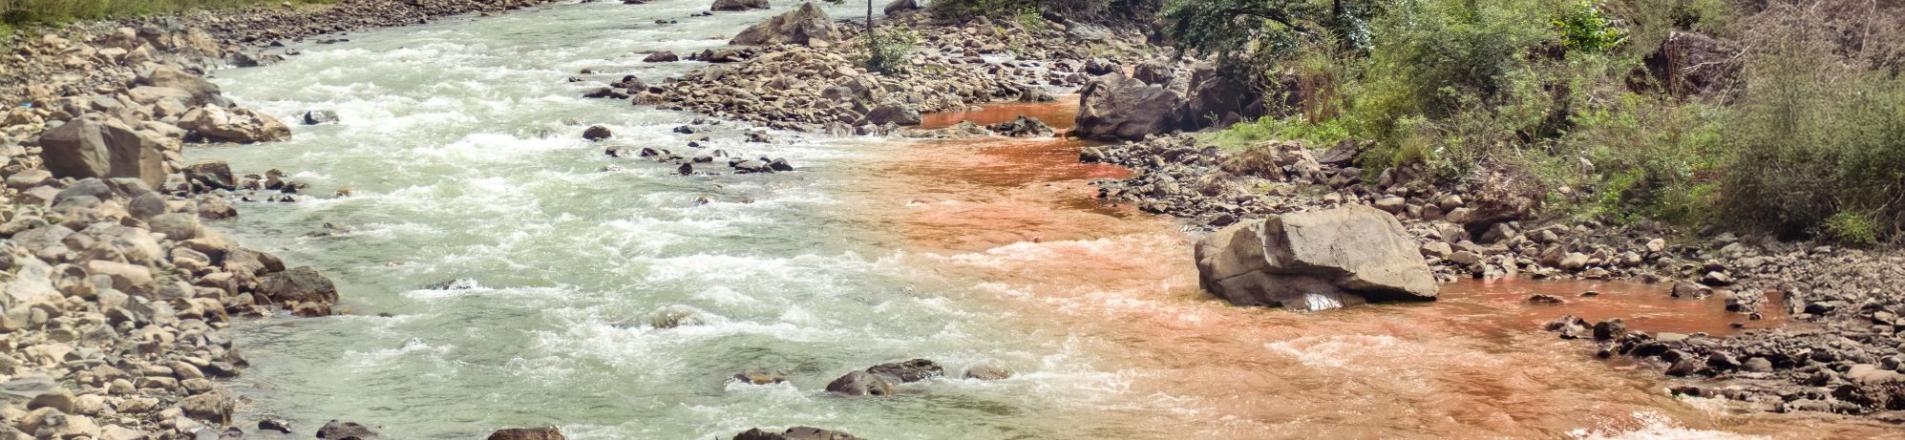
The process of extracting minerals requires large amounts of water. This water mixes with soil and rock that is disturbed during extraction, forming a waste product referred to as ‘tailings’. These tailings oxidise and weather over time, releasing a constant stream of pollutants into adjacent waterways (Schwarzenbach 2010). When these pollutants, together with harmful chemicals that are used in extraction processes (e.g. mercury or sodium cyanide), seep into the groundwater or are delivered into irrigated farmlands, they inhibit plant growth and degrade ecosystems (Du et al. 2024, Johnson and Hallberg 2005).
Assessing water pollution from mines
To find out which areas are affected by water flows from a mining site, we make use of the area’s topography. Simply speaking, water will only ever flow in one direction and never uphill. Hydrologists used this fact to construct a dataset of river basins that reflects where water will flow from any given point (Lehner and Grill 2013). We use these river basins to identify areas that receive water flows from a mining site (the downstream areas) and areas that do not (the upstream areas). Figure 1 depicts two chains of river basins around two mines.
Figure 1: Chains of river basins around two mines in Angola
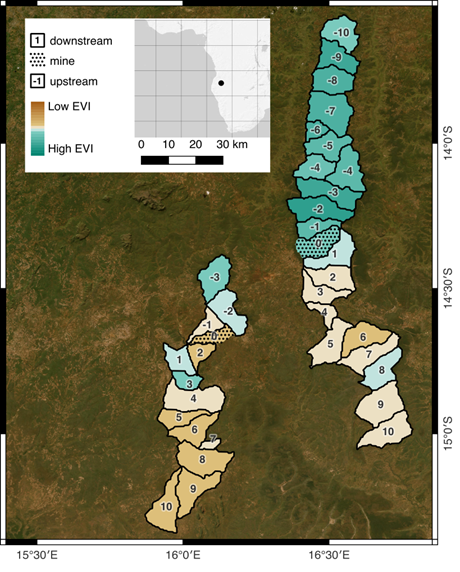
Notes: The key feature of each basin is that it exclusively drains into the next basin downstream. Labels indicate distance from the mine; negative numbers denote basins upstream of mines, positive numbers denote basins downstream of mines. Teal colouring represents healthier vegetation, while brown represents less healthy vegetation.
We can compare areas that are upstream and downstream of mines to learn about their water-transmitted effects. Naive comparisons, however, do not necessarily isolate the impacts of mines. Upstream and downstream areas could differ in other confounding characteristics that relate to water pollution. For example, downstream areas are generally more likely to contain large urban areas that could inflate naive estimates of the effect of mines. To address this concern, we focus on areas in the immediate surroundings of mines and investigate a number of potential confounders. This way, we make sure that we only estimate the average effect of water pollution from mines.
The next problem we face is the scarcity of administrative data, both for mining operations and agricultural production. For the mines, we rely on a remote sensing dataset that builds on known locations of industrial mines (Maus et al. 2022). The creators delineated the extent of these industrial, but also nearby artisanal and small-scale mines from satellite images, providing comprehensive coverage. Next, agricultural statistics for many African countries are scarce and differences in data collection render them incomparable across countries. We therefore use land use maps and the satellite-derived Enhanced Vegetation Index (EVI) to quantify how much vegetation there is in a given place and how healthy it is.
Mining in Africa reduces vegetation downstream
Our analysis shows that vegetation is indeed less healthy downstream of mines. This affects vegetation in general as well as croplands specifically. Figure 2 is a graphical representation of our main results. Reading the figure from left to right essentially amounts to following the river stream: starting from the tenth basin upstream, we see some fluctuations in the vegetation index, but no significant changes. However, as soon as we pass the mine and travel downstream of it, we notice a sudden drop in vegetation health. This drop persists for some distance, before becoming insignificant as we travel farther from the mine.
Figure 2: Average treatment effects
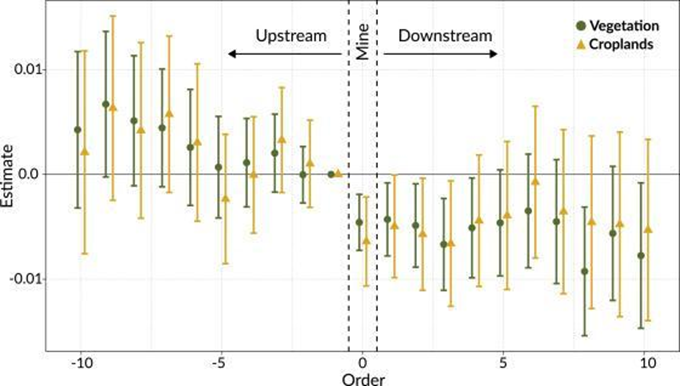
Notes: Average treatment effects (centre) and standard errors (bars) by order of basin relative to the mine for all (green, dot) and cropland-specific (yellow, triangle) vegetation. The EVI is lower downstream of mines (to the right of the order 0 basin). Taken from Vashold et al. (2026).
Next, we contextualise this drop in the vegetation index, relating it to concrete numbers. Where available, we use survey data on actual agricultural production (IFPRI 2020, Bentze and Wollburg 2024) to estimate the amount of crops lost that can be attributed to this impact of mines. We conservatively estimate that this figure ranges between 91,000 and 205,000 metric tons of cereal each year. This amount of crops lost corresponds to roughly 5–12% of the African food aid distributed by the World Food Programme in 2023.
These effects are averages, estimated across vastly different regions and settings. To gain deeper insight, we investigate how our effects differ by geography (biome, region, fertility) and mine characteristics (size, growth, primary commodity). We find that effects are strongest in Western Africa, in areas with denser vegetation, as well as in areas that are highly suitable for crops. We also find that areas where gold mining predominates are particularly affected. The size of mines, or how fast they grew, however, does not appear to make a difference.
Implications for mining policy
Regulatory oversight for mining operations is weak, particularly in the areas that are most affected by pollution from mining. Tailing containment facilities are often lacking or not properly maintained (Macklin et al. 2023), and many mines are operated informally. Our findings highlight the need for governments to regulate and monitor the use of harmful substances (sodium cyanide) and long-term containment (tailings facilities) – for both industrial and artisanal mines.
Monitoring mines and their environmental impacts is a pressing issue, but data remains scarce. We know little about the operations of artisanal and small-scale mines, but even large industrial mines operated by international companies provide little information to study their impacts. Satellite-derived measurements, for mines and agriculture, can be comprehensive and are internationally comparable, but they are coarse and can only be an approximation. Better reporting standards and better data facilitate effective responses to environmental dangers and improves our understanding and ability to mitigate detrimental impacts of mines.
References
Bentze, T P, and P R Wollburg (2024), “A longitudinal cross-country dataset on agricultural productivity and welfare in sub-Saharan Africa,” Unpublished manuscript.
Du, L, Z Zhang, Y Chen, Y Wang, C Zhou, H Yang, and W Zhang (2024), “Heterogeneous impact of soil acidification on crop yield reduction and its regulatory variables: A global meta-analysis,” Field Crops Research, 319: 109643.
Girard, V, T Molina-Millán, and G Vic (2025), “Artisanal mining in Africa: Green for gold?” Economic Journal, 135(672): 2578–2597.
IFPRI (2020), “AReNA’s DHS–GIS database.”
Johnson, B D, and K B Hallberg (2005), “Acid mine drainage remediation options: A review,” Science of the Total Environment, 338(1–2): 3–14.
Lehner, B, and G Grill (2013), “Global river hydrography and network routing: Baseline data and new approaches to study the world’s large river systems,” Hydrological Processes, 27(15): 2171–2186.
Macklin, M G, C J Thomas, A Mudbhatkal, P A Brewer, K A Hudson-Edwards, J Lewin, P Scussolini, D Eilander, A Lechner, J Owen, G Bird, D Kemp, and K R Mangalaa (2023), “Impacts of metal mining on river systems: A global assessment,” Science, 381(6664): 1345–1350.
Maus, V, S Giljum, D M da Silva, J Gutschlhofer, R P da Rosa, S Luckeneder, S L B Gass, M Lieber, and I McCallum (2022), “An update on global mining land use,” Scientific Data, 9(1): 433.
Pörtner, H-O, D C Roberts, M M B Tignor, E Poloczanska, K Mintenbeck, A Alegría, M Craig, S Langsdorf, S Löschke, V Möller, A Okem, and B Rama (eds.) (2022), Climate change 2022: Impacts, adaptation and vulnerability, Cambridge University Press.
Schwarzenbach, R P, T Egli, T B Hofstetter, U von Gunten, and B Wehrli (2010), “Global water pollution and human health,” Annual Review of Environment and Resources, 35: 109–136.
Vashold, L, G Pirich, M Heinze, and N Kuschnig (2026), “Downstream impacts of mines on agriculture in Africa,” Journal of Development Economics, 179: 103671.