


A market access model shows the negative effects of infrastructure on deforestation and the importance of accounting for general equilibrium effects
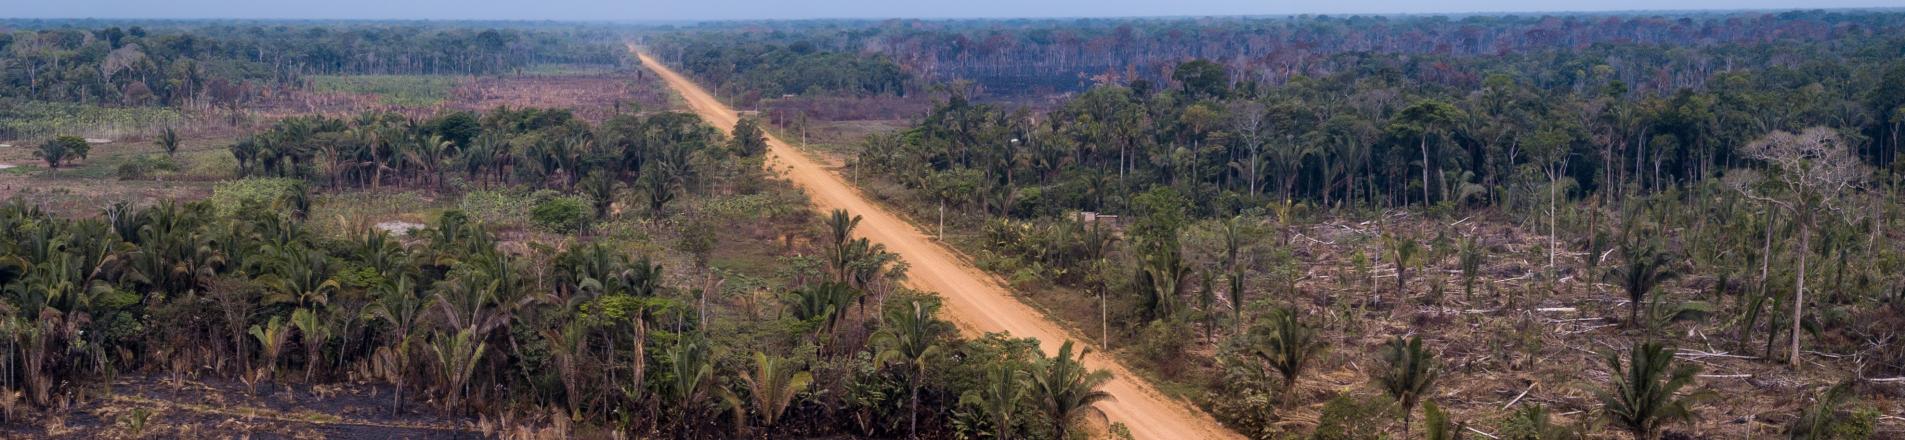
In countries like Brazil or Indonesia, where deforestation is a major source of CO2 emissions, a central question is whether there is a trade-off between forest conservation and policies focused on promoting economic growth (Foster and Rosenzweig 2003, Alix-Garcia et al. 2013, Asher et al. 2020, Garg and Shenoy 2021). Investment in transportation infrastructure is an example of this potential trade-off. These investments have long been considered a pillar for economic growth in developing countries (Costinot and Donaldson 2016, Donaldson and Hornbeck 2016, Jedwab and Storeygard 2022, Fajgelbaum and Redding 2022). However, there are growing concerns that these improvements promote deforestation. Empirical evidence of this deforestation footprint is nonetheless lacking, mainly due to the non-randomness of infrastructure placement and potential general equilibrium effects.
In our recent study (Araujo et al. 2023), we model the general equilibrium effects of investments in transportation infrastructure on deforestation and apply it to map the deforestation footprint of these investments in the Amazon, the world’s largest rainforest. We develop an inter-regional trade model that connects transportation costs and deforestation in general equilibrium through a measure of market access. In our setting, changes in the infrastructure network affect transportation costs, which in turn affects market access and farmer’s decisions to deforest frontier land.
Isolation and the pressure for infrastructure
Figure 1 shows the market access measure and its evolution for all Brazilian municipalities. Despite being home to almost 30 million people, the isolation of the Amazon is significant. The region has around one-third of the market access of the rest of the country. These maps illustrate why there is so much pressure for building and upgrading transportation infrastructure in the Amazon.
Figure 1: Market Access
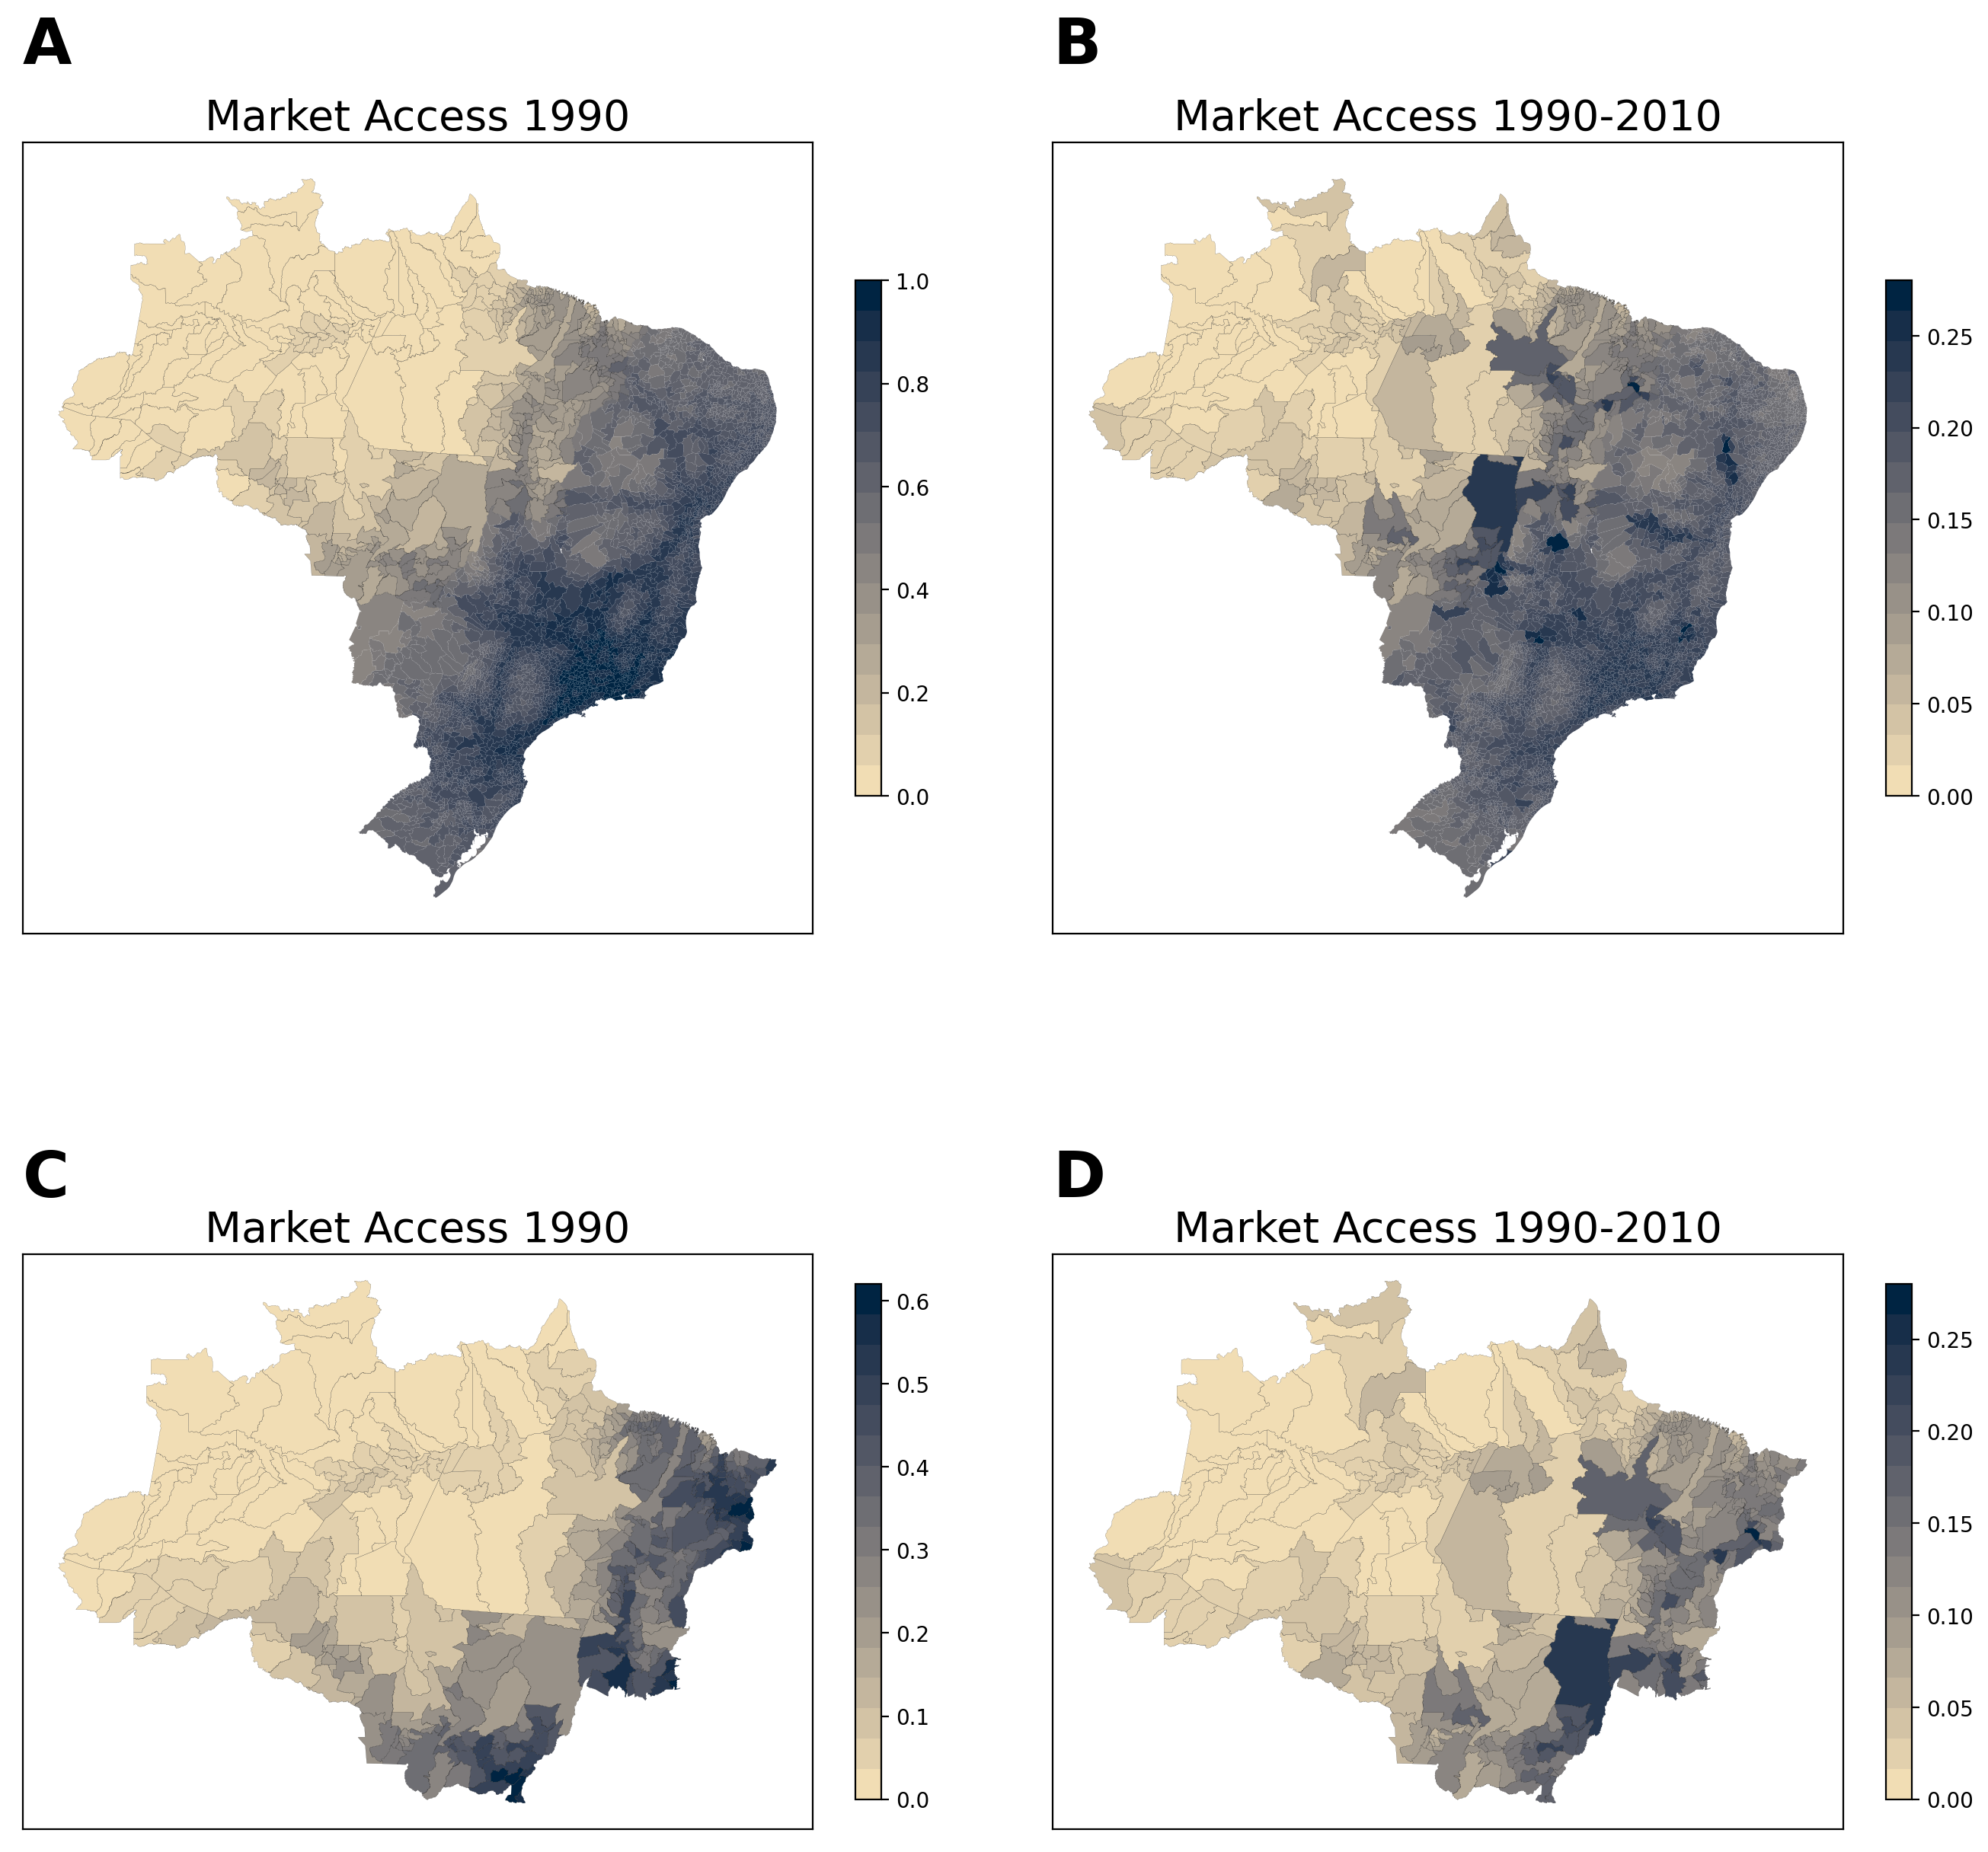
Notes: This figure shows the market access in 1990 and its change between 2020 and 1990 for Brazilian municipalities (A and B) and Brazilian Amazon municipalities (C and D).
The deforestation cost
However, investing in transportation infrastructure has a potential cost in terms of deforestation. To measure it, we estimate the relationship between deforestation and market access.
Market access depends on bilateral trade costs between regions and the distribution of the population. We use GIS information on roads, railroads, rail stations, waterways, and ports, for each decade since the 1990s, to compute the costs of transporting goods between all pairs of municipalities in Brazil and from each municipality to international markets. Our transportation network allows for multi-modal paths (e.g. using roads plus railroads to transport goods between two regions) and non-linear transportation costs (e.g. trans-shipment costs between modes of transportation).
To measure deforestation, we transform Mapbiomas (2019)’s data to identify for each pixel in the Amazon a first-time land conversion from native vegetation to pasture or cropland. Figure 2 shows the deforestation in the Amazon and its proximity to current roads.
Figure 2: Deforestation
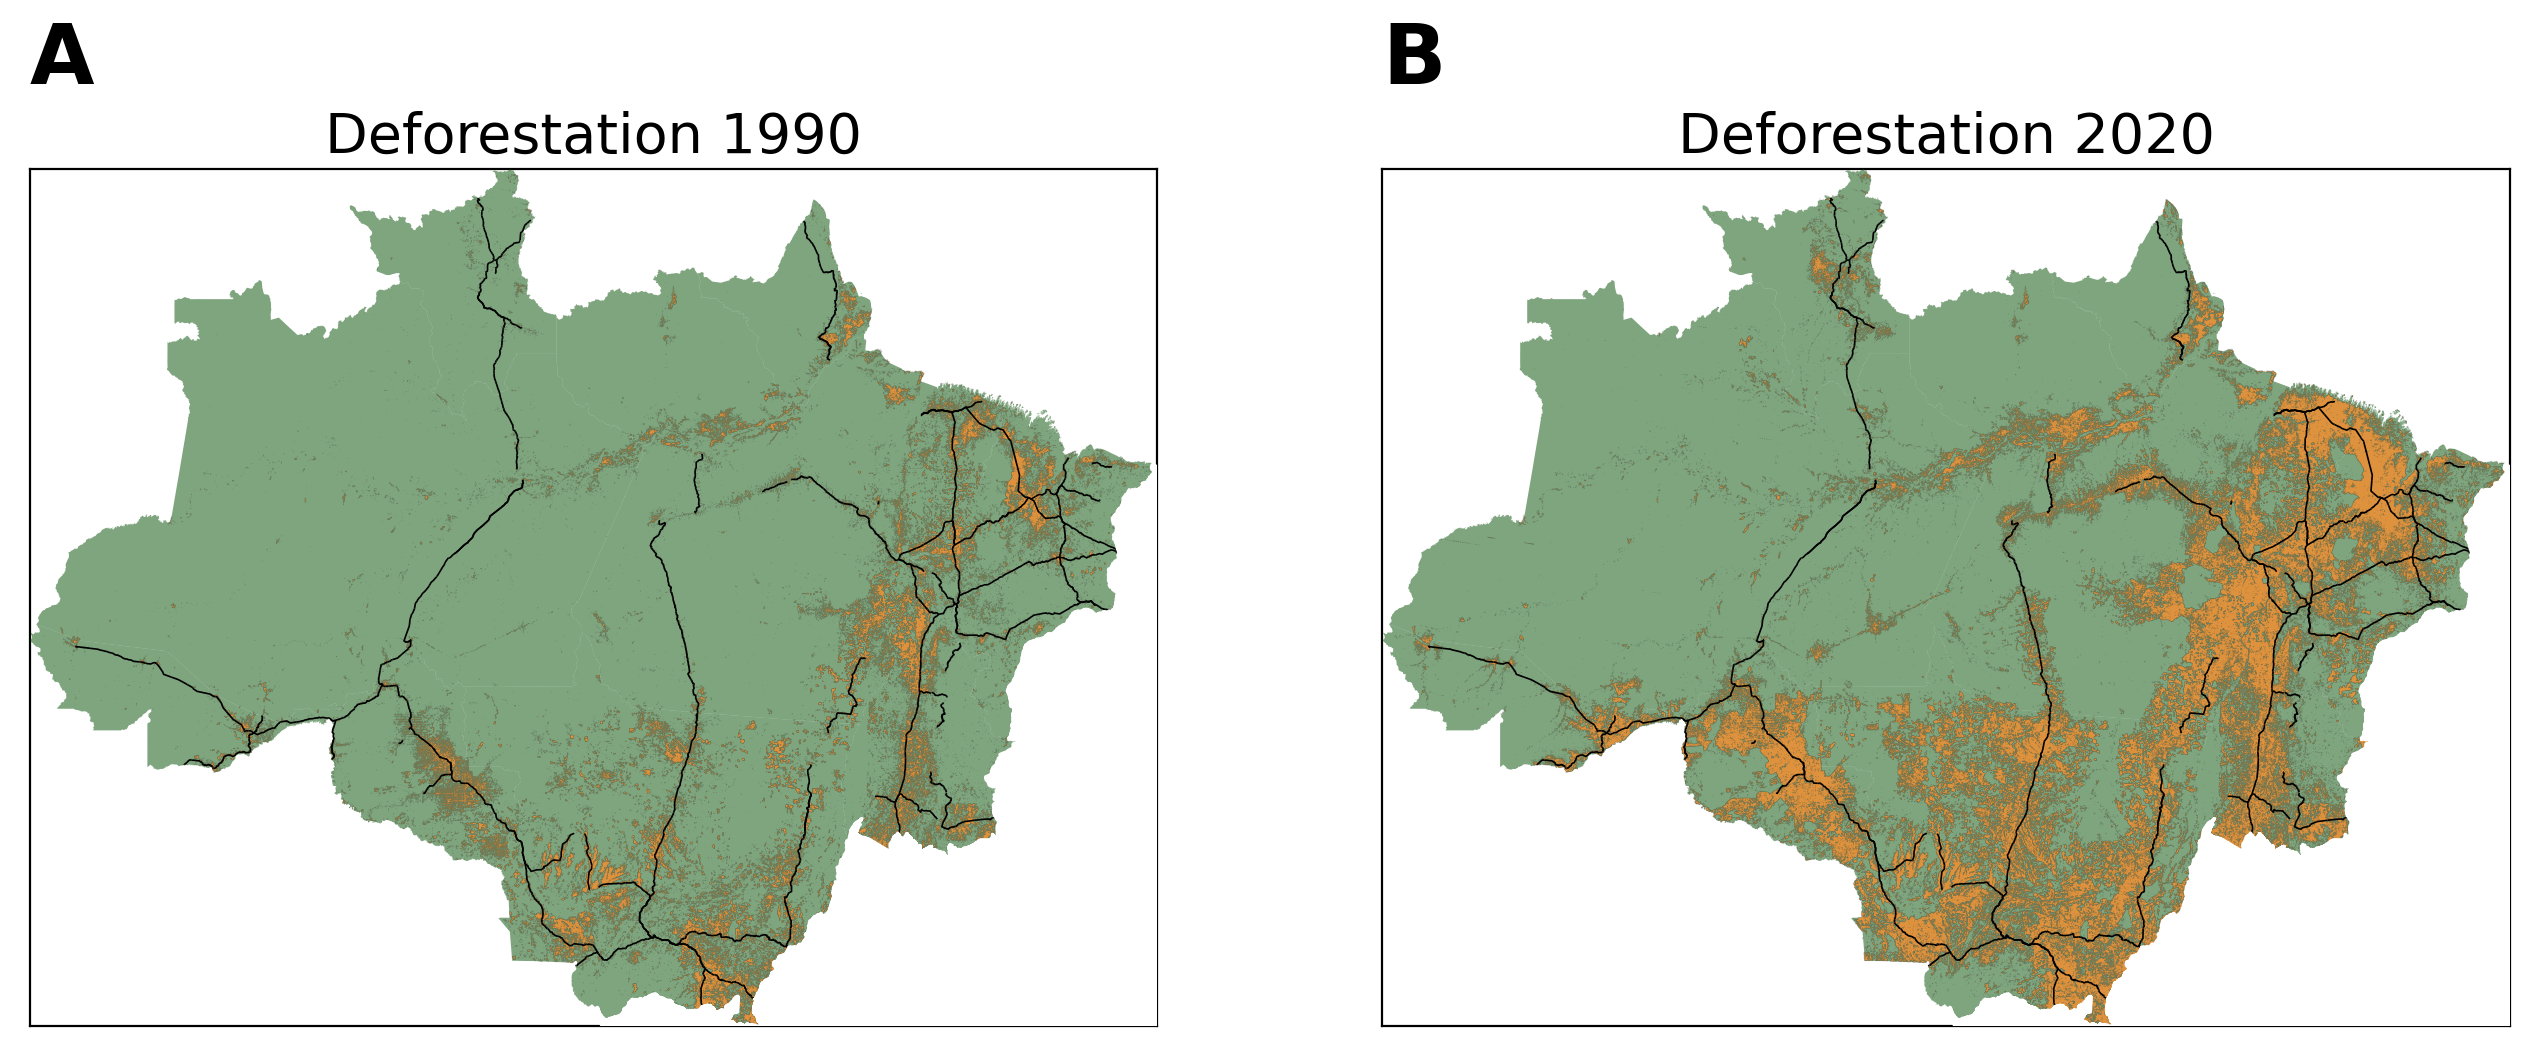
Notes: This figure shows the cumulative deforestation and its proximity to the main roads in the Brazilian Amazon in 1990 (A) and 2020 (B).
We leverage the panel and network structure of the data to isolate the variation in market access that originates from distant regions of each municipality. This enables us to account for the time-varying local shocks that might drive infrastructure building (e.g. Donaldson and Hornbeck 2016).
We find that one standard deviation increase in market access increases deforestation by 0.5 standard deviations. We further find that deforestation implied by the model strongly correlates with deforestation observed in our data, with increases in market access alone explaining 80% of the observed deforestation.
The importance of general equilibrium effects
General equilibrium effects create a complex connection between the location of investments on transportation infrastructure and the location of its impacts. To assess the importance of these general equilibrium effects, we explore the structure of the model to simulate deforestation effects of randomly placed roads added to the 2010 transportation network. We compare these model-implied effects with the effects that would be estimated by a difference-in-differences strategy, using the municipalities crossed by the road as the treatment group and their neighbouring municipalities as the control group. With this exercise, for each road we can compare the deforestation effect implied by the model with the effect recovered by using a methodology that does not account for general equilibrium effects.
We find the difference-in-differences approach underestimates the local effects of roads on deforestation. On average, not accounting for general equilibrium effects would result in underestimating by one-quarter the local effects of roads on deforestation. However, there is a significant share of simulations with much higher bias. Figure 3 reports the percentage of the true local effect of deforestation captured by the reduced form approach.
Figure 3: Random roads and what we miss by ignoring general equilibrium effects

Notes: This figure shows the location of 1000 random roads drawn in the Brazilian Amazon from which we simulate, road by road, its deforestation effect (A) and the distribution of the proportion of the true deforestation effect that is recovered by a difference-in-differences approach (B).
The deforestation effects of individual projects
An ex-ante evaluation of deforestation caused by infrastructure projects is crucial for infrastructure planning. First, it helps to determine the potential cost-benefit of different projects under analysis, improving project selection. Second, it helps to map the localities potentially affected by a project, guiding consultations with the local populations and the implementation of mitigation measures.
As an example, we build a counterfactual scenario for the construction of the Ferrogrão railroad (Figure 4). Ferrogrão’s construction is meant to facilitate the logistics of producers from the state of Mato Grosso. In 2020, Mato Grosso was responsible for 15% of Brazil’s agricultural output, exporting 70% of its production using ports located more than 2,000 kilometres from the state. Ferrogrão’s construction will reduce transportation costs considerably by enabling these producers to export through closer ports in the North of Brazil.
We modify our transportation network to include the proposed railroad and use our estimates to compute its effects on deforestation. We find that the Ferrogrão construction is expected to increase total deforestation by 400 km2 in the following decade. Figure 3 shows this deforestation footprint, which is not concentrated in municipalities immediately along the railroad, being dispersed in municipalities throughout the mid-north of the state of Mato Grosso.
Assuming a forest carbon stock of 48,510 total carbon dioxide (tCO2) per km2 and a carbon price of US$ 5 per tCO2, we find that this deforestation will generate an environmental cost of $97 million. This is a lower bound of the true environmental cost as it does not consider other ecosystem services and uses a carbon value that is far from recent estimates of the social cost of carbon, usually starting at $50 (EPA 2016).
Figure 4: Ferrogrão and deforestation
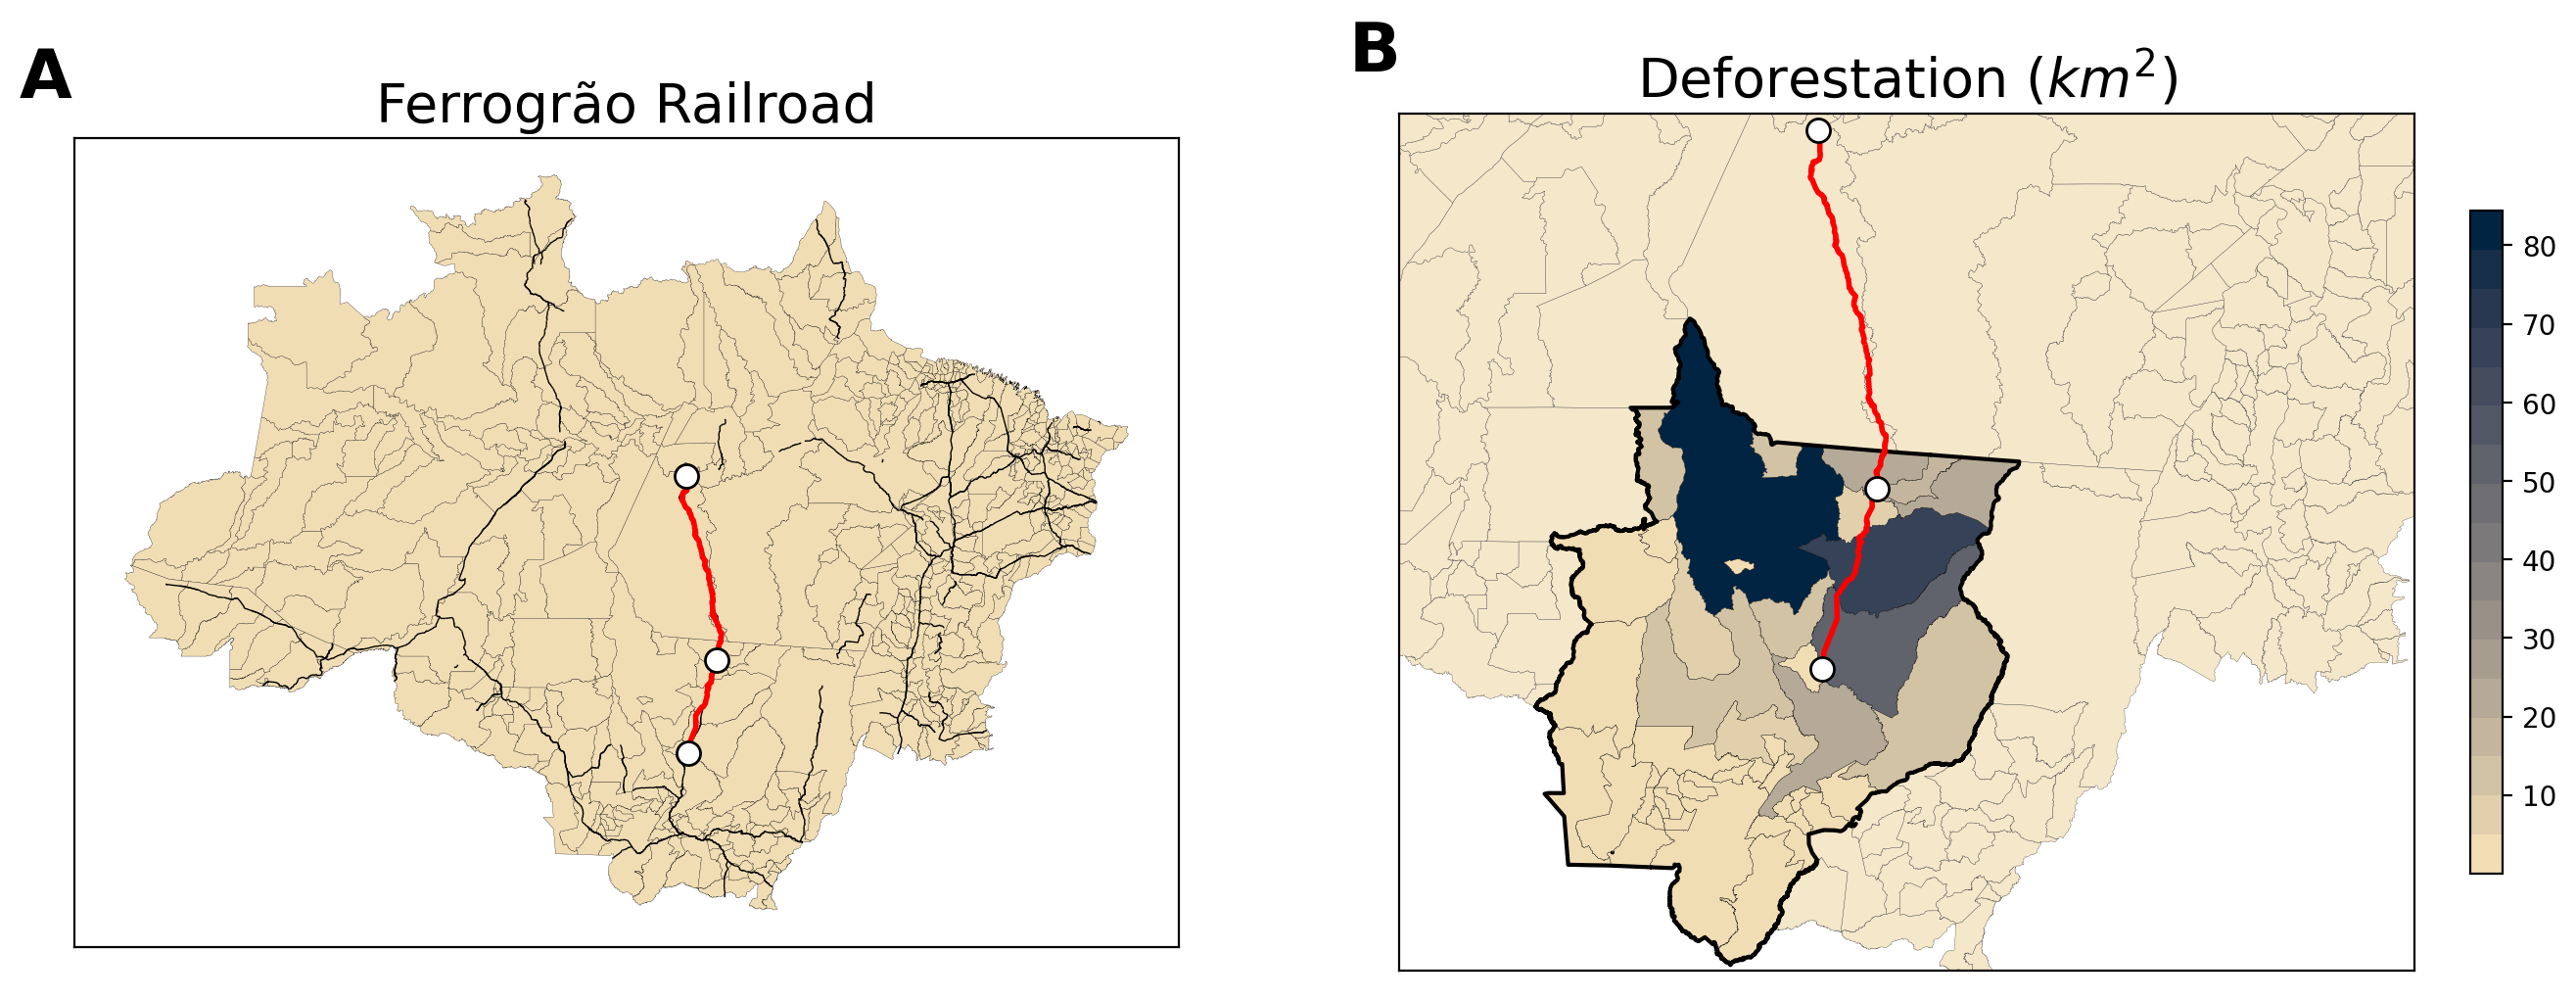
Notes: This figure shows the location of the proposed Ferrogrão railroad (A) and its predicted deforestation footprint (B).
Conclusion
The comprehensiveness and flexibility of our transportation network allow for studying a wide range of counterfactuals, such as the effects of building roads, the effects of regulations (e.g. price controls or taxes on specific types of transportation modes), and the effects of inefficiencies (e.g. heterogeneity times to process trans-shipment in different ports).
Brazil will face important decisions on infrastructure building in the Amazon region for the coming years. It is crucial to develop tools to map the environmental costs of infrastructure projects and the people affected by them. Better tools create better public policies and advance our knowledge of the drivers of deforestation in the tropics (Assunção et al. 2020, 2022, 2023, Souza-Rodrigues 2019, Burgess et al. 2019, Araujo et al. 2020, Bragança and Dahis 2022). Our results highlight the importance that infrastructure investments have on deforestation and the importance of accounting for general equilibrium effects.
References
Alix-Garcia, J, C McIntosh, K R Sims, and J R Welch (2013), “The Ecological Footprint of Poverty Alleviation: Evidence from Mexico’s Oportunidades Program”, Review of Economics and Statistics 95(2): 417–435.
Araujo, R, F Costa, and M Sant’Anna (2020), “Efficient Forestation in The Brazilian Amazon: Evidence from A Dynamic Model”, Working paper.
Araujo, R, J Assunção, and A Bragança (2023), “The Effects of Transportation Infrastructure on Deforestation in The Amazon: A General Equilibrium Approach”, Working paper.
Asher, S, T Garg, and P Novosad (2020), “The Ecological Footprint of Transportation Infrastructure”, The Economic Journal 130(629): 1173-1199.
Assunção, J, C Gandour, R Rocha, and R Rocha (2020), “The Effect of Rural Credit on Deforestation: Evidence from The Brazilian Amazon”, The Economic Journal 130(626): 290– 330.
Assunção, J, R McMillan, J Murphy, and E Souza-Rodrigues (2022), “Optimal Environmental Targeting in The Amazon Rainforest”, The Review of Economic Studies: rdac064.
Assunção, J, C Gandour, and R Rocha (2023), “DETER-ing Deforestation in the Amazon: Environmental Monitoring and Law Enforcement”, American Economic Journal: Applied Economics 15(2): 125-56.
Bragança, A, and R Dahis (2022), “Cutting Special Interests by The Roots: Evidence from The Brazilian Amazon”, Journal of Public Economics 215:104753.
Burgess, R, F Costa, and B A Olken (2019), “The Brazilian Amazon’s Double Reversal of Fortune”, Working paper.
Costinot, A, and D Donaldson (2016), “How Large Are the Gains from Economic Integration? Theory and Evidence from Us Agriculture, 1880-1997”, NBER Working Paper 22946.
Donaldson, D, and R Hornbeck (2016), “Railroads and American Economic Growth: A “Market Access” Approach”, The Quarterly Journal of Economics 131(2): 799–858.
EPA (2016). Social Cost of Carbon. Environmental Protection Agency (EPA): Washington, DC, USA.
Fajgelbaum, P, and S J Redding (2022), “Trade, Structural Transformation, And Development: Evidence from Argentina 1869–1914”, Journal of Political Economy 130(5): 1249–1318.
Foster, A D, and M R Rosenzweig (2003), “Economic Growth and The Rise of Forests”, The Quarterly Journal of Economics 118(2): 601–637.
Garg, T, and A Shenoy (2021), “The Ecological Impact of Place-Based Economic Policies”, American Journal of Agricultural Economics 103(4): 1239–1250.
Jedwab, R, and A Storeygard (2022), “The Average and Heterogeneous Effects of Transportation Investments: Evidence from Sub-Saharan Africa 1960–2010”, Journal of the European Economic Association 20(1): 1–38.
Mapbiomas (2019), Mapbiomas project. Collection 4.0.
Souza-Rodrigues, E (2019), “Deforestation in the Amazon: A Unified Framework for Estimation and Policy Analysis”, The Review of Economic Studies 86(6): 2713–2744.