


Clustering of firms in Indonesia only leads to substantial productivity spillovers in a few industries, suggesting the need to review cluster policies
Throughout the world, one striking fact about economic geography is that firms and workers tend to agglomerate, or cluster together, in certain places. This could be because some locations possess valuable natural resources, or because firms save on transport costs when they locate near their customers. However, from a policy perspective, an exciting possibility is that spatial concentration is driven by the power of productivity spillovers.
By productivity spillovers, we refer to the idea that firms grow more productive simply by being located near other firms. These spillovers, or external economies of scale, can take many forms, including shared ideas or technologies, thick local labour markets, or intermediate input linkages (Marshall 1890). If localised productivity spillovers are large and important, they provide a promising rationale for governments to spend resources on cluster development.
Promoting cluster development
Subsidies to attract firms to specific places may be initially costly, but because of productivity spillovers, those clusters may further stimulate productivity growth, attracting more entry and employment. This could create a self-sustaining, virtuous circle of development, with growth dividends that enable the subsidy to pay for itself over time. However, without large productivity spillovers, cluster development might be wasteful, as it would simply move economic activity from one place to another without any national economic benefits.
To design and implement effective cluster policies, we need a better understanding of how and why firms cluster and whether clustering generates positive spillovers. To this end, in a recent working paper (Bazzi et al. 2017), we develop a strategy for estimating the size of productivity spillovers between firms using the structure of industrial networks.
The Indonesian policy context
Indonesia represents an interesting setting for examining productivity spillovers and spatial concentration. Because of its unique geography as an archipelago, colonised by the Dutch, spatial inequalities in the concentration of economic activity and employment have been a central feature of Indonesia’s economy for centuries.
During Suharto’s presidency, which began in 1967, the government made many efforts to stimulate growth in lagging regions. Suharto’s New Order regime implemented several regional development programmes, including large-scale population resettlement, mass primary school construction, block grant transfers to underdeveloped villages, special economic zones, and road construction efforts. During Suharto’s reign, Indonesia’s economy rapidly transformed, growing from one of the poorest countries in Asia to one of the emerging Tigers.1 The country’s manufacturing activity played an important role in that growth.
After the Asian Financial Crisis in May 1997, which toppled Suharto and ushered in democratic reforms, the government rapidly decentralised. District governments became more powerful and exerted greater control over local policies. Over this period, the country also rapidly urbanised. In 1950, 15% of Indonesia’s population lived in urban areas, but by 2010, the urban population was 44%. Understanding the extent to which productivity spillovers led to urbanisation in Indonesia, and the contribution of these spillovers to growth, are important areas of research.
Methodology: Identifying productivity spillovers between firms
Unobserved factors
Identifying productivity spillovers between firms is a challenging econometric problem. If a group of firms in a certain location are highly productive, it could be because of productivity spillovers, but other factors may also be driving this correlation. For instance, some unobserved factor that lowers production costs or raises productivity could also give rise to a clustering of productive firms (Ellison and Glaeser 1999). Alternatively, high wages or land prices in the location may prohibit the entry of less-productive firms. Observations of correlations between firms’ productivities can only take us so far in our understanding (Manski 1993).
Exclusion restriction
To make progress, we need an exclusion restriction: knowledge of some factor that affects the productivity of neighbouring firms but does not directly affect that firm’s own productivity. In our research, we use exclusion restrictions that come from the structure of firm relationships. Shocks to firms that are linked through a network, but only indirectly, can provide a source of identifying variation.
For example, Figure 1 depicts a network where nodes (circles) represent firms in two cities: Jakarta and Bandung. There are six firms in Jakarta (A, B, C, D, E, and F), and three firms in Bandung (G, H, and I). Within cities, all firms are connected to one another. Firms in the same industry, depicted with the same colour, are also connected. For example, firms F, E, and I have connections drawn in red that span the two cities.
Figure 1 Identification example
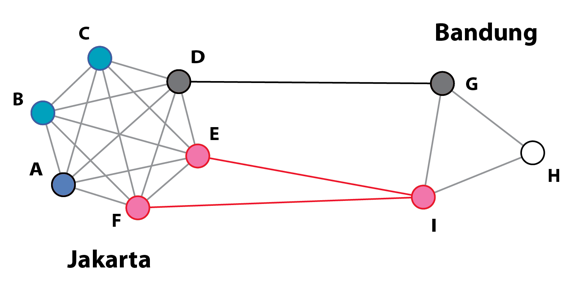
Notes: The six firms in Jakarta (A, B, C, D, E, and F) are linked by physical proximity, as are the 3 firms in Bandung (G, H, and I). Different colours indicate different industries.
Our goal is to identify how increases in the productivity of a firm’s neighbours affect that firm’s own productivity. Consider a positive shock to firm H’s productivity, driven, for example, by a favourable exchange rate shock to that firm’s industry. With spillovers, that shock will affect the productivity of all immediately neighbouring firms (G and I), but it won’t directly affect the productivity of firms A, B, or C. It only affects those firms’ productivity through the productivity of the firms’ neighbours, thus providing the exclusion restriction we need.
Firm-level networks
To measure industrial and geographic connections between firms, we use data on the different products that industries produce and consume as raw materials to construct a network of forward and backward linkages. These data enable us to create a series of firm-level networks, assuming that firms are connected to one another if:
- they are in the same industry,
- their industries are related to each other through forward or backward linkages, or
- they are located in close physical proximity.
Figure 2 presents a visualisation of the firm network linkages that we identified, using data from the year 2000. In 2000, the network contained 21,834 firms and slightly more than 1 million connections. This network structure has many ‘small worlds’ properties that are similar to other networks, including the network of US industries, the structure of the internet, and gene networks (Acemoglu et al. 2016, Carvalho 2014).
Figure 2 Network of firms
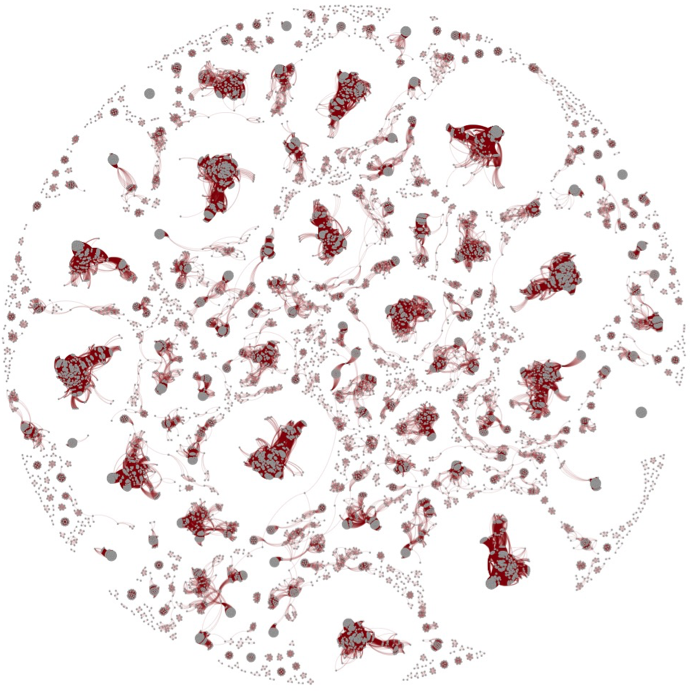
Source: Authors’ calculations where connections arise for all firms within the same district (d = 0) and/or at least 1% of shared inputs (s = 0.01). Visualisation uses the force-placement algorithm of Fruchterman and Reingold (1991).
Findings: Exchange rate shocks and productivity spillovers
Using this network structure and exchange rate shocks applied to a panel of data on manufacturing firms, we find that exchange rate shocks have a meaningful impact on the productivity of ‘neighbours-of-neighbours’. We use this finding to estimate positive average productivity spillovers between firms in Indonesia, but our estimates are substantially smaller than those found in the literature on US and European firms. These relatively small estimates of productivity spillovers echo other work on agglomeration externalities in Indonesia.
However, for some industries, the productivity spillovers we observe are substantial, suggesting that cluster development policies may need to be properly targeted. In particular, we estimate large productivity spillovers between firms in Indonesia’s finished metal, machines, and electronics industry. An important question is whether policymakers can design policies to leverage spillovers that are specific to certain industries and harness their growth potential, or whether these organic spillovers would disappear in response to government intervention.
Editor's note: This article is based on this PEDL Project.
References
Acemoglu, D, Akcigit, U and Kerr, W (2016), “Networks and the Macroeconomy: An Empirical Exploration”, NBER Macroeconomics Annual 30: 273–335.
Bazzi, S, Chari, A, Nataraj, S and Rothenberg, A D (2017), "Identifying Productivity Spillovers Using the Structure of Production Networks", Working Paper.
Carvalho, V M (2014), “From Micro to Macro via Production Networks”, Journal of Economic Perspectives 28: 23–48.
Ellison, G and Glaeser, E (1999), “The Geographic Concentration of Industry: Does Natural Advantage Explain Agglomeration?”, American Economic Review 89: 311–316.
Fruchterman, T M J and Reingold E M (1991), “Graph Drawing by Force-Directed Placement”, Software: Practice and Experience 21: 1129–1164.
Marshall, A (1890), Principles of Economics, London: Macmillan and Co.
Manski, C F (1993), “Identification of Endogenous Social Effects: The Reflection Problem”, Review of Economic Studies 60: 531–542.
Endnotes
[1] The term indicates countries that experience a rapid economic growth. Originally the Asian Tigers were four countries – South Korea, Singapore, Hong Kong and Taiwan – and were later followed by another five countries – Indonesia, Malaysia, Thailand, Vietnam and the Philippines.