

Providing performance feedback on delays in public service delivery speeds up bureaucrats, but faster delivery does not decrease corruption. Instead, positive feedback to well-performing bureaucrats worsens corruption.
Paying government officials to provide a public service in less time is a common form of corruption. This has led some to believe that corruption causes faster service delivery by creating an incentive for bureaucrats to improve delivery speeds (e.g. Leff 1964). Another view is that corruption is the root cause of slow service delivery as when service delivery is slow in the absence of bribes, more people are encouraged to pay bribes. Therefore, government officials or agencies deliberately slow down service delivery to increase bribes (e.g. Rose-Ackerman 1978, Kaufmann and Wei 1999). Both of these views suggest that there would be a double benefit from improving the average speed of service delivery. First, all citizens who need the service would get it faster. Second, this will reduce corruption by reducing the amount people are willing to pay for faster service delivery.
The scorecard experiment
In my working paper (Mattsson 2022), I test the hypothesis that corruption can be reduced by speeding up service delivery using an information system that monitors delays. I conduct an experiment with the Bangladesh Civil Service and focus on one service - the processing of applications for changes to land records. When a piece of land changes owner, an application has to be made to update the government record of who owns this land. In each sub-district, there is one bureaucrat (the head of the sub-district land office) who is responsible for processing these applications. These bureaucrats have a 45 working day limit within which they should process all applications, but in practice this is not strictly adhered to. For example, only 56% of applications in my control group are processed within this time limit.
I use data from an e-governance system to create monthly scorecards measuring delays in processing. The scorecards have two performance indicators - the number of applications processed within the official time limit, and the number of applications pending beyond that limit. It also shows the bureaucrats’ relative performance on these indicators, compared to all other bureaucrats in the experiment. The scorecards are sent both to the bureaucrats and their supervisors.
The random assignment was done at the office level and took place in two waves alongside the roll-out of the e-governance system. In September 2018, the first wave of randomisation was carried out, with half of the 112 offices that had installed the e-governance system receiving the scorecards. Six months later, another 199 offices that had installed the e-governance system since the first randomisation were also added to the experiment. In total, the experiment covers more than half of all sub-district land offices in Bangladesh, serving a population of approximately 97 million people.
I use the administrative data from the e-governance system to measure the effect of the scorecards on processing times. To measure bribe payments, I survey applicants in the offices that are part of the first wave of randomisation about six to twelve months after the start of the experiment. Applicants were first interviewed in person when they came to the land office for a land record change, and then again over the phone about three months later. In the phone interview, they were asked how much they thought a normal person like themselves pays, above the official fee, to get their application processed. They were also asked how much they themselves paid, and the results below are similar regardless of which measure is used.
The scorecards’ effects on processing times and bribes
I first show that the scorecards improved processing times. The fraction of applications processed within the time limit increased by six percentage points, that is, by 11% for a typical land office, and overall processing times decreased by 13%. Figure 1 shows that the effect starts almost immediately after the first scorecards were sent out and does not decline over time.
Figure 1: Percentage of Applications Processed Within 45 Working Days
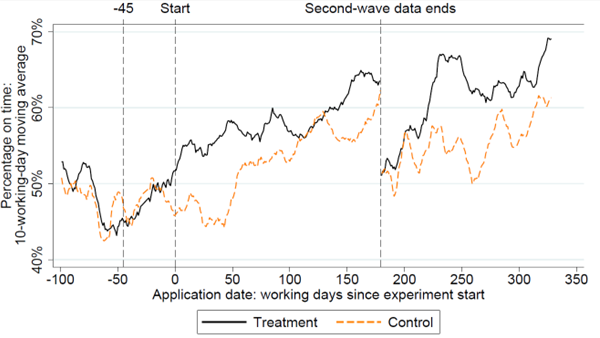
Notes: The first vertical line marks 45 working days before the first scorecard. The scorecards may affect applications made after this date. The second vertical line represents the date of the first scorecard, applications made after this date were fully treated. The third vertical line represents the end of the data from the offices in the second randomisation wave. After this, there is only data from the first randomisation wave.
Despite faster processing times, bribes did not decrease. Instead, the overall effect of the scorecards on reported bribes is positive, although not statistically significant. One potential reason we do not see a decrease in bribe payments is that the applicants were not aware that processing times had improved. However, an additional intervention providing information to applicants about the improved processing times does not change the scorecards’ effect on bribes.
Different effects for high-performing vs low-performing offices
Figure 2 separately shows the effects for offices that were performing below and above the median in terms of delays at baseline. The estimates on the left show that the scorecards’ effect on processing times is almost entirely driven by low-performing offices and that there was almost no effect on high-performing offices in terms of processing times. The estimates on the right show that the scorecards increased bribe payments in high-performing offices but that there was no effect on bribe payments among low-performing offices.
Figure 2: Heterogeneity in effect by baseline performance
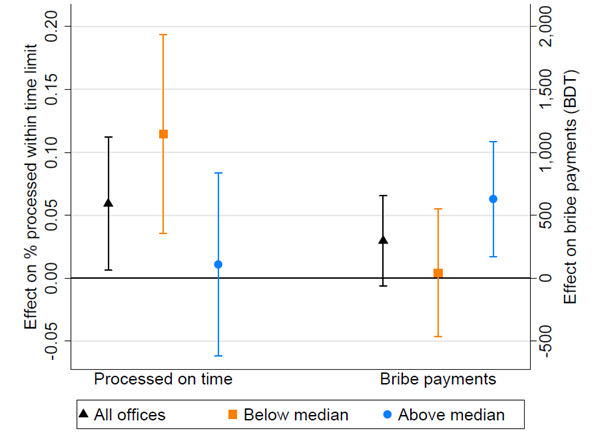
Notes: This figure shows regression coefficients and 95% confidence intervals for the effects of the scorecards. The overall effect is estimated in one regression, then in a different regression, the effects for offices that had processing times performances above and below the median at baseline are estimated separately. In the estimates to the left, the outcome variable is an indicator variable for if the application was processed within the time limit. In the estimates to the right, the outcome variable is applicants’ responses to the question of how much a normal person like themselves pays, above the official fee, to get their application processed. 1 US$ ≈ 84.3 Bangladeshi Taka (BDT) during this time period.
In the paper, I show that these results can be explained by a model where bureaucrats’ reputational concerns constrain corruption. When bureaucrats get positive feedback through the scorecards, this constraint is relaxed, and this allows them to collect more bribes.
What did we learn?
The result that the scorecards improve processing times adds to a literature showing that providing information about the performance of government officials within a bureaucracy can change their behaviour, even without explicit incentives (e.g. Dodge et al. 2021, Callen et al. 2020). Leveraging data from e-governance systems could, therefore, be a cheap way to improve bureaucratic efficiency. Because the scorecards were provided to the bureaucrats and to their supervisors, a limitation of the study is that I cannot disentangle if this effect was driven by supervisors getting the information, or bureaucrats seeing their own performance.
The results on bribe payments imply that if we want to reduce corruption, improving the speed of service delivery will not help, at least not in this context. They also suggest that the idea that corruption is the underlying reason for slow service delivery may be incorrect. Since faster average service delivery does not decrease bureaucrats’ ability to take bribes, there is no reason for them to want service delivery to be slow on average.
Finally, the paper’s model highlights how reputational concerns may motivate bureaucrats to perform their tasks well, and that these concerns may increase with more visibility of their performance. It also points out a potential risk of providing positive performance feedback. Positive feedback can have negative spillovers, especially on aspects of job performance that are less visible. In this study, the result was that positive performance feedback led to more corruption, but in other contexts, the negative spillovers might be on different aspects of job performance. This highlights the need to measure performance across multiple dimensions when evaluating similar interventions.
References
Callen, M, S Gulzar, A Hasanain, M Y Khan, and A Rezaee (2020), “Data and policy decisions: Experimental evidence from Pakistan”, Journal of Development Economics, 146: 102523.
Dodge, E, Y Neggers, R Pande, and C Moore (2021), “Updating the state: Information acquisition costs and public benefit delivery”, Working Paper.
Kaufmann, D and S-J Wei (1999), “Does ‘grease money’ speed up the wheels of commerce?”, NBER Working Paper 7093.
Leff, N H (1964), “Economic development through bureaucratic corruption”, American Behavioral Scientist, 8(3): 8–14.
Rose-Ackerman, S (1978), Corruption: A Study in Political Economy, New York: Academic Press.