

In the conflict between Christians and Muslims in Nigeria, fear (rather than hate) is the main driver, it is founded on misperceptions, and proves hard to change with policy.
Social conflict and hostile behaviour between ethnic or religious groups is prevalent in the global south. However, we still lack clarity on why citizens support or engage in hostile behaviour towards another ethnic/religious group, instead of cooperating. To answer this question, my research (Ortiz 2023) focuses on two fundamental motives for action—preferences and beliefs. Supporting hostilities may be rooted in preferences if individuals hate the other group (the outgroup) and want to harm them. Alternatively, this support could stem from beliefs if individuals do not hate the outgroup but fear that the outgroup wants to harm their group (the ingroup), in which case they could support hostile actions to protect themselves. This distinction is important because different drivers of social conflict call for different types of policy interventions. However, empirically disentangling the motives for action is challenging.
Disentangling hate and fear as motives of social conflict
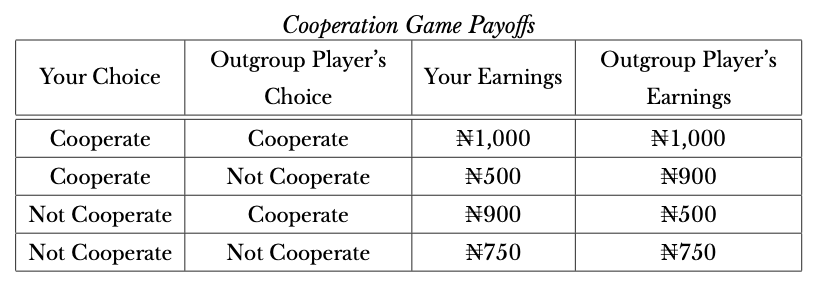
To do this, I design a set of games where participants play for real money. The main game emulates a conflict dynamic by conceptualising social conflict as a manifestation of cooperation failure (as in Fearon & Laitin 1996). In it, there are two players from opposing ethnic/religious groups, and each player can choose to cooperate or not cooperate (the hostile action). They make their decision independently from each other and at the same time. If both players choose to cooperate, each player gets the maximum payoff possible. However, there are two reasons to not cooperate:
- If a player hates the outgroup, she might prefer to not cooperate, earn a somewhat less than the maximum payoff and reduce the outgroup player’s payoff by a greater amount.
- If a player fears the outgroup player is hateful and therefore non-cooperative, she will also want to not cooperate to lose less money than she would otherwise.
To understand where non-cooperative decisions come from, I have participants play two other games beforehand, one to elicit preferences and another one to elicit beliefs. The preferences game determines how hateful (or altruistic) a participant is towards the outgroup by eliciting how much money they are willing to pay themselves to reduce (or increase) the experiment payment of an outgroup participant by a fixed amount. Crucially, this game revealed if a participant was hateful enough to want to not cooperate out of hate in the upcoming cooperation game. The beliefs game asked participants to guess the outgroup participants’ decisions in the preferences game—it asked participants to guess what percentage of outgroup participants picked the hateful option in a particular situation of the preferences game. The beliefs game captured fear by revealing how likely participants thought it was that an outgroup member wanted to not cooperate out of hate in the upcoming cooperation game. Analysing these three games together allowed me to study why people decided to not cooperate.
I deployed this set of games as a lab-in-the-field experiment in Jos, Nigeria—a city with Christians and Muslims that in the past 25 years has experienced a series of outbreaks of religious violence perpetrated by ordinary citizens, and a resulting process of religious segregation.
Fear is the main driver and is unfounded
Figure 1: Social preferences
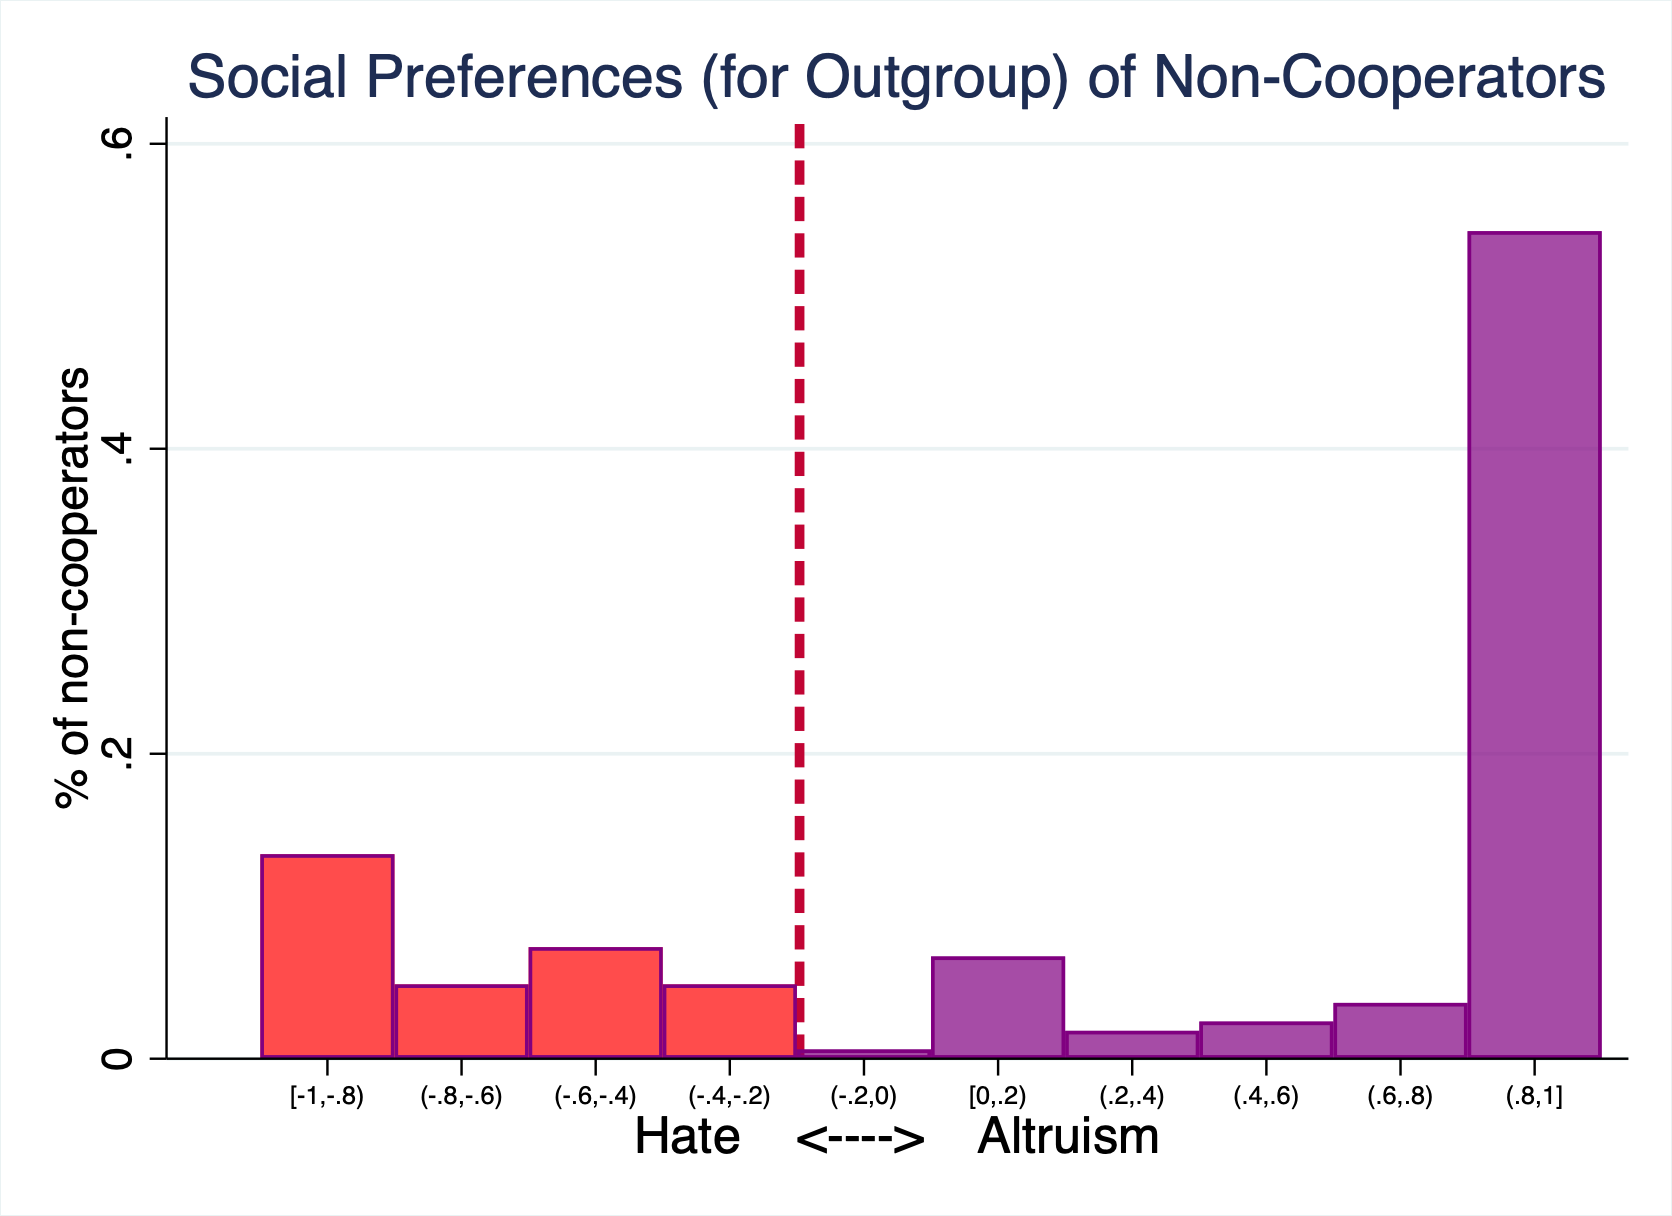
Using the information from the preferences game, where participants revealed how hateful or altruistic they are towards the outgroup, I assigned each participant a social preference parameter (from -1 to 1, where the more negative the parameter, the more hateful a person is, and the more positive, the more altruistic). Figure 1 shows a histogram of the social preferences of participants who decided to not cooperate. From all non-cooperators, left of the dashed line are the people who are hateful enough to want to not cooperate out of hate in the cooperation game. This group is 24% of non-cooperators. Right of the dashed line are the non-cooperators who did not have a hateful reason to not cooperate and presumably did so out of fear. This group is 76% of non-cooperators, which shows that fear is the main driver of non-cooperation.
Figure 2: Beliefs about the Outgroup, by choice in cooperation game
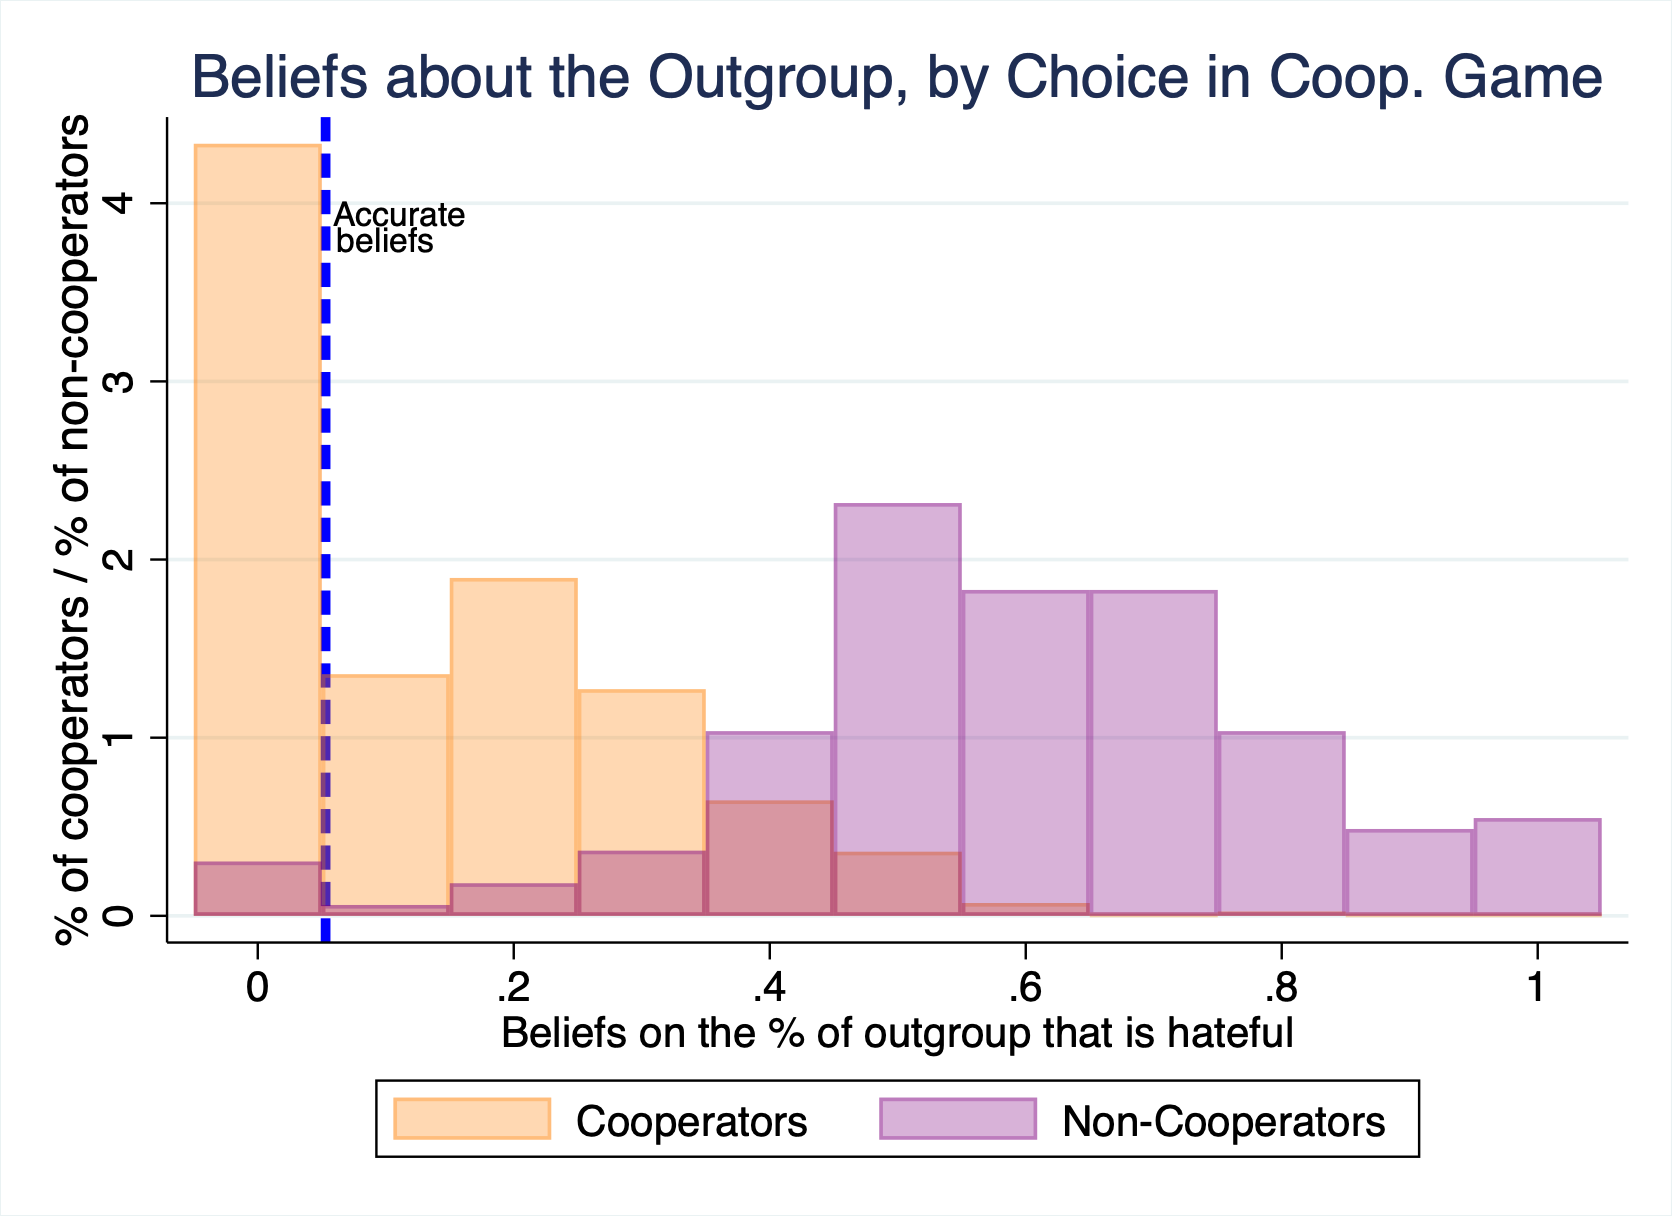
Figure 2 shows participants’ beliefs about the outgroup level of hate towards the ingroup—that is, participants’ level of fear towards the outgroup. In particular, it shows what percentage of the outgroup participants believe is hateful enough to want to not cooperate. And it shows these beliefs separately for people who cooperated and people who did not. The dashed line shows the actual percentage of the outgroup that was hateful. The figure shows that participants who decided to cooperate have beliefs about the outgroup that are on average rather accurate. However, non-cooperators have huge misperceptions about the outgroup: on average they think 60% of the outgroup is hateful, while in reality it is only 6%. This shows how fear is not only the main driver of conflict, but also one that in unfounded.
Figure 3: Social preferences, beliefs and cooperation
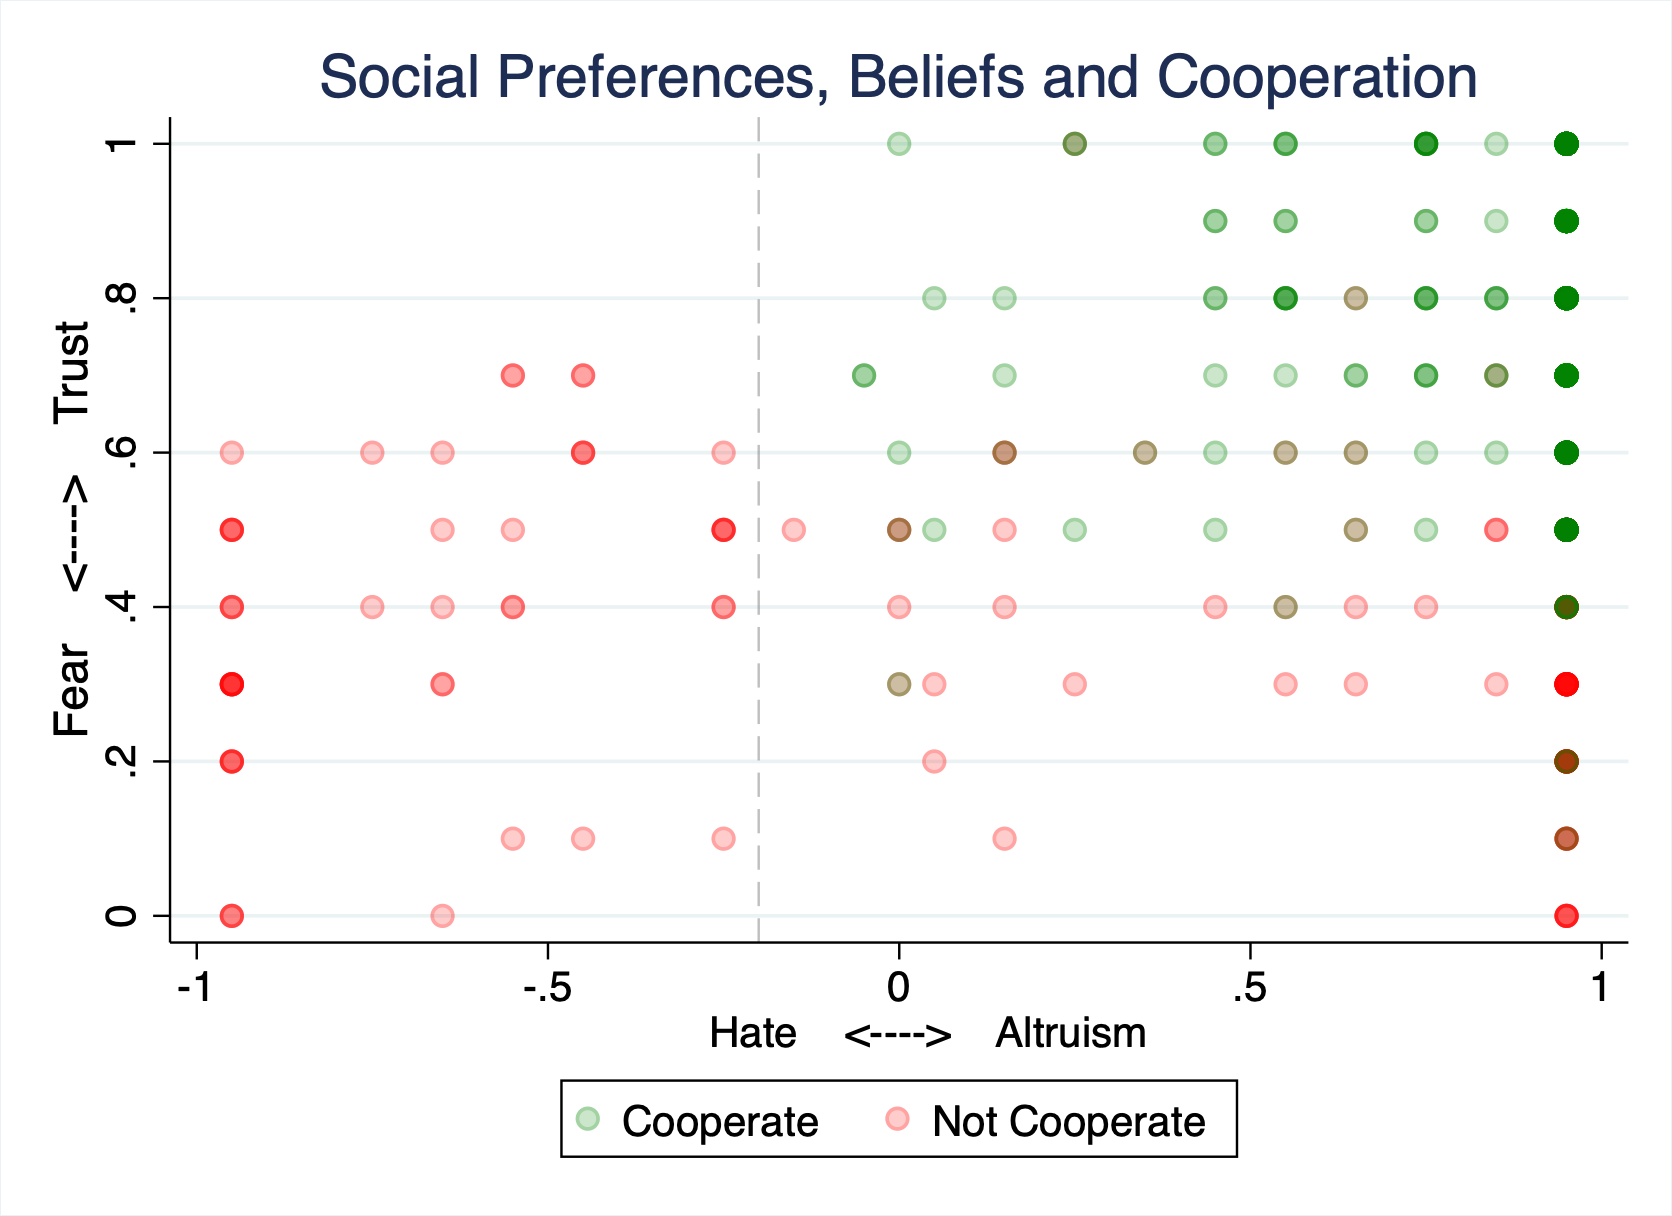
Figure 3 shows the information of all three games for all participants. The x-axis shows social preferences, the y-axis shows beliefs. Each participant is represented by a dot. The dot is green if a participant cooperated and red if she did not. The dots are translucent and can overlap, such that darker dots indicate a higher density of people at that preference-belief level. As in Figure 1, left of the dashed line are the people who are hateful enough to have a hateful reason to not cooperate (and right of the dashed line are those who don’t have a hateful reason to not cooperate but could have a fearful reason to do so).
Three things are worth noticing. First, to the left of the dashed line, no one cooperates. Second, to the right of the dashed line, the higher the level of fear, the higher the ratio of non-cooperation. Third, and importantly, hateful people tend to also be very fearful, while altruistic people have a wide range of beliefs, from fully fearful to fully trusting.
Policy analysis: An RCT of a radio drama to increase cooperation
Are policy interventions currently used to mitigate conflict able to address the problem identified above? I study the case of radio dramas. Radio dramas are a popular intervention in Sub-Saharan Africa to promote messages on different issues, like health. It has also been popular as an intervention to mitigate conflict, given that fictional stories make it easier to discuss sensitive topics, and also increases attention to and retention of the message.
For this part, I partnered with a radio drama production company from Nigeria and we created a new radio drama. The show told a story where hate and unfounded fears led two communities to miss out on mutually beneficial interaction—its objective was to reduce both hate and fear. The show consisted of 24 episodes, each 10-15 minutes long, and it was released throughout six weeks.
With it, I did an RCT where half of participants of the lab-in-the-field experiment were provided access to the radio drama. After the six weeks of treatment, participants went through a second lab-in-the-field experiment that measured how their levels of hate, fear and cooperation changed, using the same games as before. Randomisation was done at the individual level, and to achieve this, the episodes were sent to participants through WhatsApp, instead of the radio show being broadcasted. The control group listened to a “placebo” radio drama with a message on health.
I find that the radio drama was effective at reducing hate (by 0.45 standard deviations), but was ineffective at reducing unfounded fears. Furthermore, it was also ineffective at increasing cooperation. This result, that could have been puzzling, can be explained by the diagnosis done before. The radio show is an effective policy because it reduces hate, but it is inefficient at achieving its main goal (increasing cooperation), because it does not affect the key driver of non-cooperation, which is unfounded fears. Partly, this result is driven by the fact that hateful people are also very fearful, so even without hate, they still had a fearful reason to not cooperate. This result highlights the importance of understanding the motives of conflict in order to select and design effective policies.
References
Fearon, J D and D D Laitin (1996), "Explaining Interethnic Cooperation." American Political Science Review, 90(4): 715–735. Publisher: Cambridge University Press.
Ortiz, Miguel (2023), “Hate, Fear and Intergroup Conflict: Experimental Evidence from Nigeria”. Working paper available here.