


Over the past half-century, global inequality has fallen. However, within countries, inequality has increased.
How people fare in the increasingly global economy is one of the big questions of our time. Has everybody benefited equally from the past era of economic growth, and what are the most important factors in the way that income is distributed? A few recent studies have tried to examine this question, estimating the level of global income inequality from a compilation of national household surveys since the late 1980s (e.g. Anand and Segal 2015, Bourguignon 2015, Lakner and Milanovic 2015). they find that global income inequality is high – higher than in any single country – but that it has fallen since the 1990s, largely as a result of rapid income growth in low- and middle-income countries.
In recent work, we take a different approach. We focus exclusively on labour earnings, which is the main income source for the vast majority of the world’s population (Hammar and Waldenström 2017). We create the first estimates of global earnings inequality, its trend between 1970 and 2015, and some evidence on its main drivers.
Falling global earnings inequality (1970-2015)
The estimation of the global earnings inequality rests on a unique earnings survey database run by UBS, a Swiss bank. It contains data on earnings, taxes, working hours, and local prices for workers in 15 representative occupations. The data have been collected in the same way every third year since 1970, in up to 85 cities in 66 countries, in all the world’s continents. We match it with occupational and country population data from the ILO and the World Bank. Our balanced sample covers more than 80% of the global population, and correlates well with statistics from other sources. It should be noted that the tails of the distribution are not well covered in our data, but imputations from other sources (top incomes from the World Wealth and Income Database, for example) suggest only a modest impact on the global earnings inequality trend.
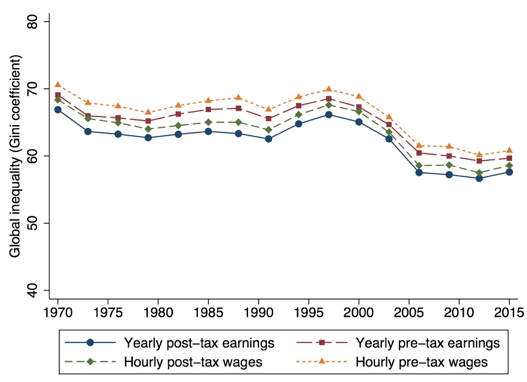
Figure 1 shows the main result – that global earnings inequality was very high in 1970 (with a Gini coefficient of around 70), but has fallen to a lower level today (around 60). The main equalisation occurred in the late 1990s and 2000s. Global pre-tax inequality is higher than global post-tax inequality (approximately 3 Gini points), and inequality is higher for hourly wages than for yearly earnings (approximately 1 percentage point). The latter suggests a negative relationship between earnings and hours worked at the global level. Compared with earlier studies on global inequality in income or consumption, we find that inequality in earnings and wages is slightly lower, but follows a similar trend.
Figure 1 Global earnings inequality trend, 1970-2015
The UBS data let us follow each occupational group, in each country, over time. This means we can identify the winners and losers in the decline in inequality by plotting the earnings growth of each country-occupation since the 1970s against its initial rank in the global earnings distribution. Figure 2 shows this non-anonymous growth incidence curve. For illustration, we have marked a low- and a high-earning occupation (unskilled construction workers versus skilled department managers, respectively) in some sample countries. This illustrates the earnings dispersion both within and between countries, and shows that average earnings growth over this period has been higher in the lower half of the global distribution than in the upper half.
Figure 2 Growth incidence of country-occupations (1970s-2010s)
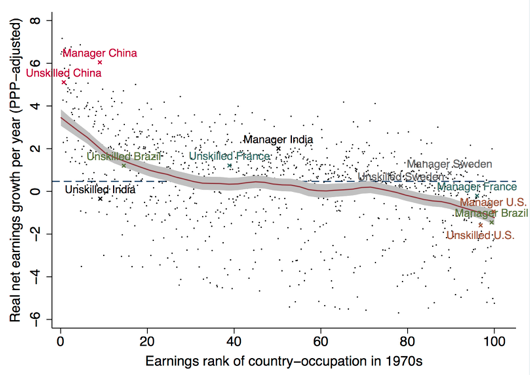
Note: Each point represents a country-occupation. Dashed line shows average growth for all observations, and solid line a smoothed local polynomial with 95% confidence interval.
Inequality has increased within countries but decreased between countries
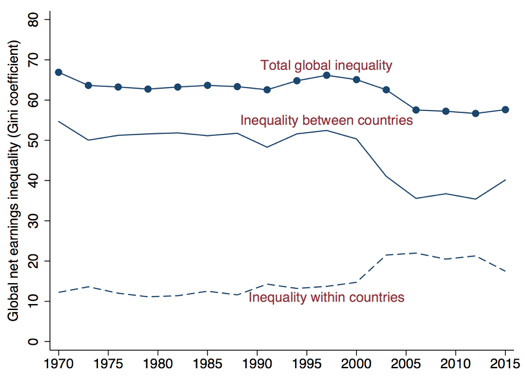
Decomposing the global earnings inequality trend within and between countries, we find that within-country inequality rose over this period (by 5 Gini points), while between-country inequality fell (by 15 points), leading to the combined effect of a 10-point fall in total earnings inequality. In Figure 3, we can also see that the main shift in both of these trends took place at almost the same time, during the early years of the 21st century. We also find that inequality within occupations has fallen, especially within the traded, industrial sector. This suggests that globalisation could be a potential driver of this earnings convergence trend.
Figure 3 Global earnings inequality within and between countries (1970-2015)
Earnings growth in Asia and the agricultural sector key drivers
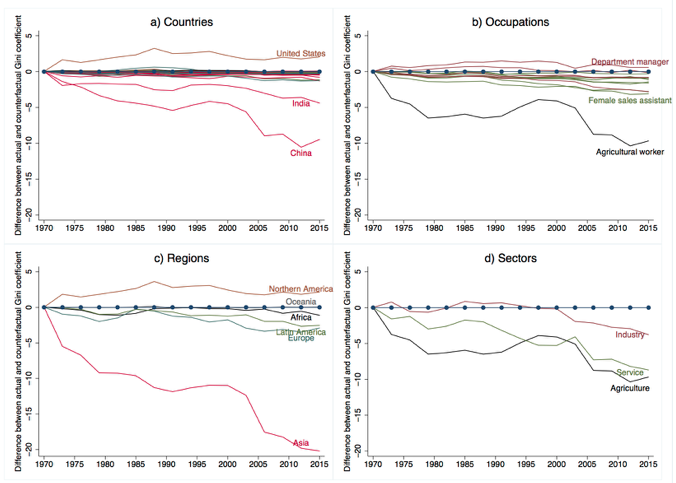
What are the drivers behind the level of, and trend in, global earnings inequality? We perform a counterfactual analysis to examine this question. This is done by comparing actual global inequality with a counterfactual inequality, for which we keep the 1970 gross hourly wages fixed for countries, occupations, regions and sectors, one at a time. In Figure 4 we see that, ceteris paribus, earnings growth in Asia contributed to a global earnings inequality drop of 20 Gini points. Similarly, earnings growth in China contributed to a fall in global earnings inequality of almost 10 percentage points. The change in earnings in the US and North America, on the other hand, increased global inequality. Among the different occupations and sectors, changes in agricultural earnings seem to be the dominant factor behind the global inequality drop, followed by earnings growth among female service workers. Earnings changes among industrial managers have had the opposite effect on global inequality.
Figure 4 Comparing actual with counterfactual inequality, holding 1970 earnings constant
A falling trend in earnings inequality
Our new evidence on global earnings and wage inequality shows a falling trend over the past half-century. Similar to previous findings for global household income inequality, the main equalisation period was the late 1990s and 2000s. At this time several large, developing economies experienced high growth rates. Higher earnings in the agricultural sector, but also some low-skill urban professions, contributed specifically to this trend.
We hope that these findings and the new Global Earnings Inequality Database, which we have made publicly available, will spur further research on this important topic – as well as many other issues related to local, regional and global labour markets.
Editor’s note: This column was previously published on VoxEU.org.
References
Anand, S and Segal, P (2015). “The Global Distribution of Income”, In Atkinson A B and F Bourguignon (eds), Handbook of Income Distribution 2A, Amsterdam: North-Holland.
Bourguignon, F (2015). The Globalization of Inequality, Princeton, NJ: Princeton University Press.
Hammar, O and Waldenström, D (2017). “Global Earnings Inequality, 1970-2015”, CEPR Discussion Paper 12019.
Lakner, C and Milanovic, B (2015). “Global Income Distribution: From the Fall of the Berlin Wall to the Great Recession”, World Bank Economic Review 30(2): 203-232.