


Evidence from India shows that R&D tax credit policies which targeted specific sectors generated meaningful welfare gains, particularly through improvements in product quality and product variety.
A recent report by the World Intellectual Property Organization (WIPO 2025) highlights that innovation investments have significantly decelerated in recent years, and R&D growth has declined to its lowest point since 2009. These findings emphasise the need for policymakers to foster innovation globally. Relatedly, governments are now increasingly adopting targeted industrial policies, such as R&D tax incentives, to catalyse in-house innovation within firms and strategic sectors. Although there is substantial evidence that R&D tax credits stimulate firm level innovation – such as increases in R&D expenditures, patenting activity, and entrepreneurship (Melnik 2024, Dechezleprêtre et al. 2023, Rao 2016, Bloom et al. 2002) – much less is known about the specific forms these innovation investments take in terms of product development.
We exploit a tax reform in India, proposed in the Union Budget of 1997–98, which aimed to increase R&D tax credits for firms with in-house R&D units registered with the Ministry of Science & Technology, Government of India. The reform was initially introduced for firms in the drugs and pharmaceuticals, chemicals, electronic equipment, computers, and telecommunication equipment sectors in 1997–98, and was later extended to include helicopters and aircraft in 2001, and automobiles and auto parts in 2004.
This R&D tax credit policy partitioned firms based on a clearly defined eligibility criterion, creating a set of eligible and non-eligible firms that were impacted by the reform. Our study uses this classification to causally estimate the relative effects of the reform, both within and across industries, using a difference-in-differences strategy on R&D, product scope, and product quality.
Studying manufacturing firms in India
For our study (Chakraborty, Mathur, Sircar, and Verma 2025), we use the CMIE PROWESS dataset and use data for more than 9,200 firms in the manufacturing sector during the 1992–2007 period. These firms are predominantly private Indian firms or affiliated with private business groups, with a small fraction being government-owned or foreign-owned.
The database is compiled from audited annual reports and information submitted to the Ministry of Corporate Affairs (MCA), Government of India. It provides a wide range of firm-level characteristics, including, but not limited to, total sales, exports, imports, and raw material expenses. Firms report data on our key variable, amount of R&D expenses undertaken, as required under Section 217 of the Companies Act. Specifically, Section 217(1)(e) mandates that this information be attached to every balance sheet presented at a firm’s Annual General Meeting, in a report prepared by its board of directors.
Additionally, we use the Department of Scientific and Industrial Research (DSIR) reports to obtain data regarding a key aspect of the R&D policy: in-house R&D units.
Do tax credit reforms have an impact on firms?
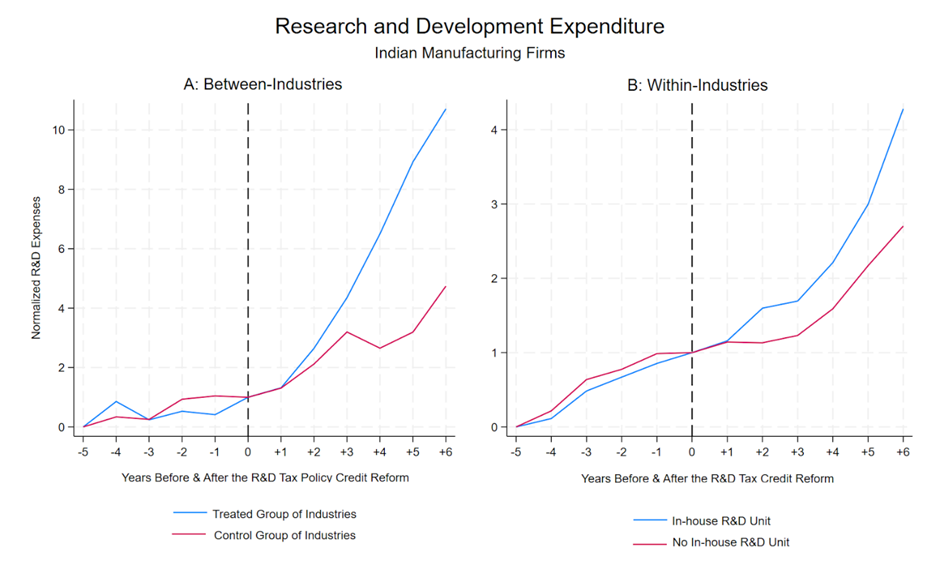
Panel A of Figure 1 shows that firms in industries eligible for the tax credit (treated firms) experienced a significantly larger increase in R&D expenditure after the reform compared to firms in non-eligible industries (control firms). Panel B examines firms with and without in-house R&D facilities and finds similar patterns – firms with in-house R&D saw a greater rise in R&D spending. This within-industry comparison reinforces the conclusion that the tax credit led to increased R&D investment.
Figure 1: Research and Development Expenditure
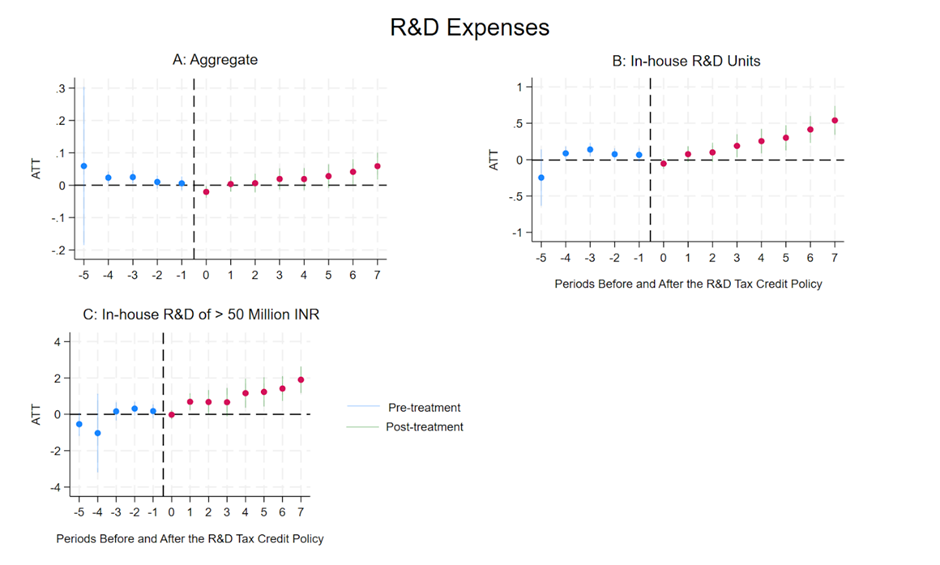
Panels A, B, and C of Figure 2 illustrate the trajectory of R&D spending for three categories of firms: (i) those operating in industries where the R&D tax credit policy was implemented; (ii) those in eligible industries with an in-house R&D unit; and (iii) those in eligible industries with an in-house R&D unit and R&D expenses exceeding 50 million INR.
Before the policy, firms across these categories did not show significant differences in R&D expenditure. Following the implementation of the tax credit, however, there was a marked increase in R&D spending—especially among firms with in-house R&D capabilities and those with larger R&D budgets (above 50 million INR).
Figure 2: Effects of R&D Tax Credit on R&D Expenditure
Our formal analysis, based on a difference-in-differences approach, reveals several key findings. First, firms in industries targeted by the policy experienced an average 11% increase in R&D expenditures. Importantly, this effect is entirely driven by firms with in-house R&D units. For these firms, the impact is much larger, with R&D spending rising by up to 71%. The estimates account for a range of controls, including firm characteristics (such as age and output), unobserved firm and industry fixed effects, and time trends.
We also find that firms with over 50 million INR in in-house R&D spending experienced the highest growth in R&D expenditures – approximately 650%. This is followed by firms spending between 10–50 million INR, which saw a 148% increase, and firms spending less than 10 million INR, which recorded a 12% increase. Our estimates suggest that this growth is primarily driven by incumbent firms, particularly those with R&D expenses above 50 million INR threshold. While there is some evidence of extensive margin in terms of establishing new in-house R&D units, this effect appears limited to firms with R&D expenses of 10–50 million INR.
Inside the black box of R&D spending: How firms invest in innovation
Given the observed increase in R&D spending, a natural question is: what exactly are firms investing in? To answer this, our study introduces a multi-product framework that identifies three key channels of a firm maximising output: production scale, product scope, and product quality.
Our model shows that larger firms tend to benefit more from investing in the quality of their existing products – through improvements like better packaging, branding, or marketing – rather than launching entirely new products. This is because introducing new products can lead to cannibalisation, where the new product eats into the sales of the firm’s current offerings, ultimately reducing overall profits. The risk of cannibalisation is especially high when the firm’s products are closely substitutable.
For instance, if Coca-Cola already sells multiple types of cola, such as regular Coke, Diet Coke, and Coke Zero, adding a new orange-flavoured Coke might not increase total demand. Instead, it could simply shift customers away from the existing variants, without expanding market share.
On the other hand, for smaller firms with limited product lines, launching new products is generally more profitable. New offerings help them enter previously untapped markets, grow their customer base, and increase profits. So, while large firms typically focus on improving the quality of what they already sell, smaller firms to use R&D spending to expand their product range.
As predicted by the model, when the tax credit policy is implemented, we find that larger firms – those with more than 50 million INR in-house R&D expenses – have the lowest probability of introducing a new product compared to firms with relatively lower R&D spending. Our results also show that the tax credit has a positive impact on product quality, an effect primarily driven by larger firms, with little to no impact observed for firms with in-house R&D expenses below 50 million INR. And, all these results are driven by firms who belong to the differentiated products industry and are exporters.
Do these policies generate welfare gains?
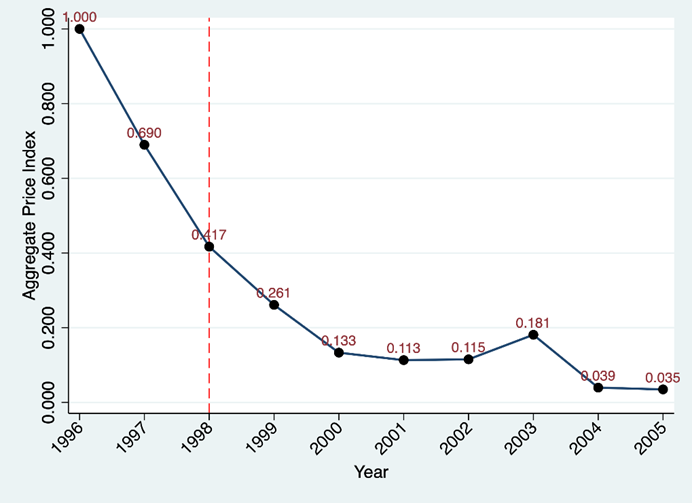
Our study also shows that the R&D tax rebate generated aggregate welfare gains by enhancing both product quality and variety. The findings indicate that if firms had invested only in expanding product scope (without improving quality), consumers would have needed to spend 11.5 times more to attain the same level of utility. In contrast, if firms had focused solely on improving product quality (without increasing scope), consumers would need to spend 3.9 times more for equivalent utility. These results highlight that improvements in quality and the expansion of product variety together led to a substantial decline in the price index (Figure 3), resulting in higher consumer surplus over the policy period.
Figure 3: Price Index
Policy implications for promoting innovation
Resource constraints, political economy challenges, and global dynamics often limit the policy space available to developing economies (Juhász and Lane 2024, Millot and Rawdanowicz 2023). In this context, the design and implementation of innovation-promoting policies must be both strategic and evidence-based, particularly as innovation is increasingly recognised as a driver of long-term development (Dugo et al. 2025, García Herrero and Schindowski 2024).
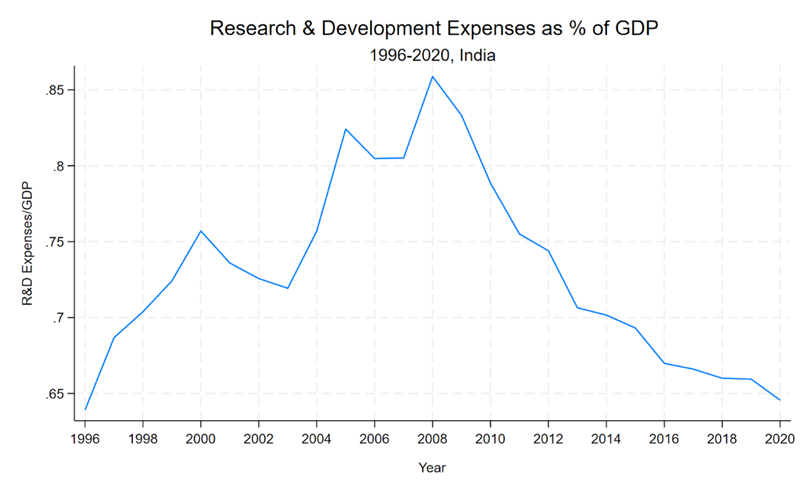
India’s performance in the 2025 Global Innovation Index – ranking 38th out of 139 countries and first among lower-middle-income economies (WIPO 2025) – highlights its growing innovation capacity. As shown in Figure 4, India’s R&D expenditure as a share of Gross Domestic Product, rose from 0.64 to approximately 0.86% between 1996 and 2008, which coincides with our study period. However, it declined ever since, and in 2020, the percentage is almost equal to what it was in 1996.
Our study contributes to this discussion by showing that R&D tax credit policies targeted at specific sectors can generate meaningful welfare gains, particularly through improvements in product quality and product variety. By incorporating firm heterogeneity into the analysis, we demonstrate how a single policy instrument can activate multiple innovation channels, offering valuable insights for policymakers seeking cost-effective tools to stimulate innovation-led growth.
Figure 4: India’s Research and Development Expenditure (% of GDP)
References
Bloom, N, R Griffith, and J Van Reenen (2002), “Do R&D tax credits work? Evidence from a panel of countries 1979–1997,” Journal of Public Economics, 85: 1–31.
Chakraborty, P, S Mathur, S Sircar, and R Verma (2025), “R&D tax credit and product quality vs. scope,” Unpublished manuscript.
Dechezleprêtre, A, E Einiö, R Martin, K-T Nguyen, and J Van Reenen (2023), “Do tax incentives increase firm innovation? An RD design for R&D, patents, and spillovers,” American Economic Journal: Economic Policy, 15: 486–521.
Dugo, A, F Erixon, and O Guinea (2025), “Models of industrial policy: Driving innovation and economic growth,” Unpublished manuscript.
García Herrero, A, and R Schindowski (2024), “Unpacking China’s industrial policy and its implications for Europe,” Unpublished manuscript.
Juhász, R, and N Lane (2024), “The political economy of industrial policy,” Journal of Economic Perspectives, 38: 27–54.
Melnik, W (2024), “R&D tax credits and innovation,” Journal of Public Economics, 232: 104995.
Millot, V, and Ł Rawdanowicz (2023), “The return of industrial policies: Policy considerations in the current context,” Unpublished manuscript.
Rao, N S (2016), “Do tax credits stimulate R&D spending? The effect of the R&D tax credit in its first decade,” Journal of Public Economics, 140: 1–12.
World Intellectual Property Organization (2025), Global innovation index, World Intellectual Property Organization.