


Evidence from Nigeria shows that protests can influence fiscal redistribution, but the manner and direction depend critically on the political relationship between disbursing governments and protesting regions.
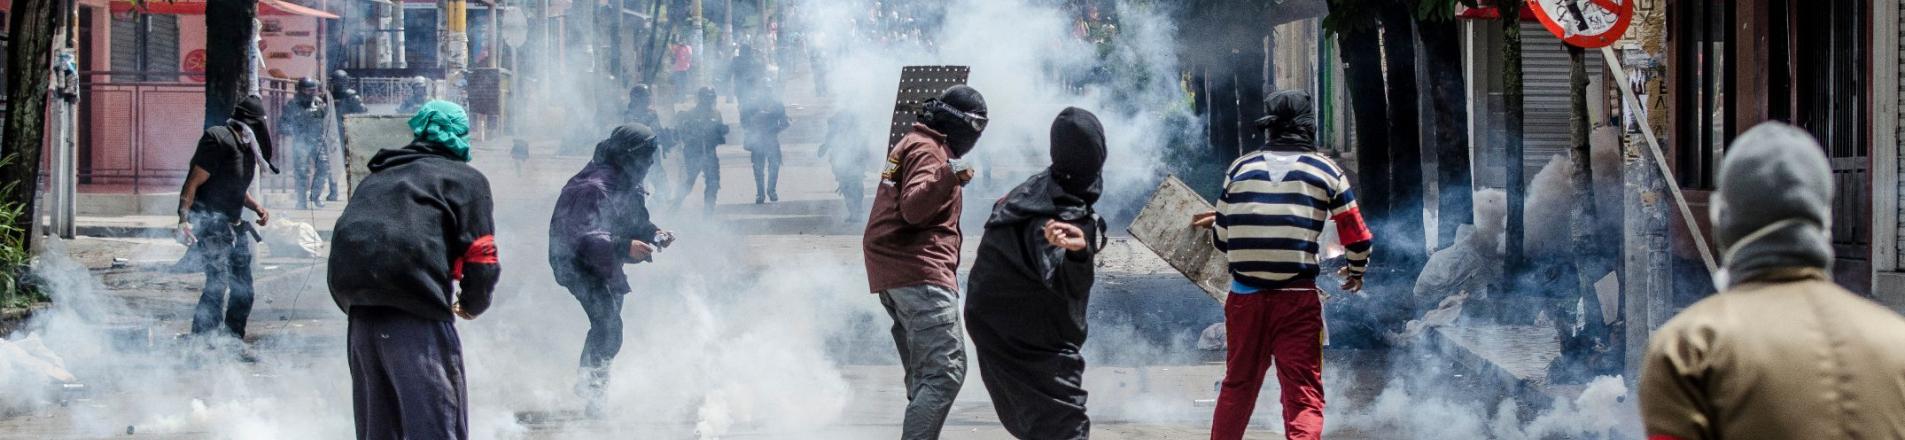
On September 17, 2011, hundreds of people marched on Zuccotti Park in Manhattan to protest economic inequality under the banner of ‘Occupy Wall Street’. The march marked the start of months-long protests worldwide, collectively labelled the Occupy movement. Three months later, another wave of demonstrations erupted in Nigeria under the banner of ‘Occupy Nigeria’, following the federal government’s removal of a long-standing fuel subsidy. The subsidy removal, implemented without warning on January 1, 2012 by the federal government, led to an overnight 115% spike in gasoline prices (Akanle et al. 2014). Protests began the following day, with reportedly millions of Nigerians participating, making it the largest mass mobilisation in the country's history at the time (Adebayo 2015).
Drawing inspiration from the economic redistribution demands of Occupy Wall Street, protesters demanded the reversal of the subsidy removal, viewing fuel subsidies as the most visible and directly impactful form of economic redistribution from government to citizens. The protests lasted nearly two weeks, with numerous protesters killed or injured by police and security forces. Given that a major stated driver of citizen participation in protests like those in the Occupy Movement is demand for economic redistribution, can protests actually lead to meaningful redistribution of economic resources?
Protests can lead to meaningful changes in the distribution of fiscal resources, depending on the relationships between governments and protesters
In new research (Archibong, Okafor, Osabuohien, and Moerenhout 2026), we answer this question using 26 years of archival public finance data from Nigeria and show that protests increase fiscal transfers to protesting regions – but only in areas where state and federal governments are politically aligned, meaning the state governor and federal president belong to the same party. Where they are not politically aligned, protests are met with increased policing and violence rather than fiscal concession.
We digitised monthly and annual public finance records from Nigeria covering 1988 to 2016, combining state-level revenue and expenditure data with geocoded protest data from the Armed Conflict Location and Event Data (ACLED) project. Nigeria is an informative setting to answer this question due to its highly centralised fiscal system which channels oil revenues through a federal allocation committee that then distributes these revenues in the form of transfers to Nigeria’s 36 states each month. In the Nigerian context, two primary transfer types flow from the federal government to states: publicly announced ‘allocation’ transfers and opaque ‘value-added tax’ (VAT) transfers, whose distribution citizens cannot easily monitor.
While transfers to states are theoretically formula-based – weighing equality of states (40–50%) and population (30–50%) as the primary inputs between 1981 and 2016. However, the administration of the formula is opaque, and the federal government discloses virtually nothing about formula inputs. The federal government therefore has full discretion over how much each state receives, particularly for opaque VAT transfers, which leaves room for politically motivated adjustment in the amount distributed to each state (Maystadt and Salihu 2019). States depend heavily on federal transfers, which make up 80% of state revenues on average.
Federal governments can use fiscal transfers strategically to quell protests that threaten political tenure and reduce re-election probability
Poor economic conditions and periodic failure to pay public sector salaries and pensions are frequently cited drivers of protest in Nigeria, with unions organising workers from teachers to healthcare workers to demand payment and improve working conditions (Adeloye et al. 2017, Orifowomo 2006). The Nigerian government has historically responded to protests through a mixture of concession – in the form of economic transfers or policy retractions – and repression through state-sponsored violence. We measure protest intensity as each state’s protest activity relative to the national average in each month, capturing how contentious a state is relative to the national political landscape.
Protests increase transfers in politically aligned states but decrease them in politically non-aligned states
Our main finding is that protests increase opaque VAT transfers in politically aligned states but decrease them in politically non-aligned states. A state experiencing notably above-average protest activity receives approximately 1.6% more monthly VAT transfers if aligned with the federal government and 0.5% less if not politically aligned. This works out to a differential of around 10 million Naira (approximately US$68,000) monthly or 259 million Naira (US$1.73 million) annually.
Two natural experiments validate this finding. The January 2012 Occupy Nigeria protests were triggered by a single national event: the removal of the fuel subsidy. Since these protests were not triggered by local political or economic conditions, the fuel subsidy removal allows us to isolate the causal effect of protests on transfers (Figure 1).
Figure 1: Total number of protests each month, with the January 2012 subsidy removal and start of the Occupy Nigeria protests marked, 2000–2016
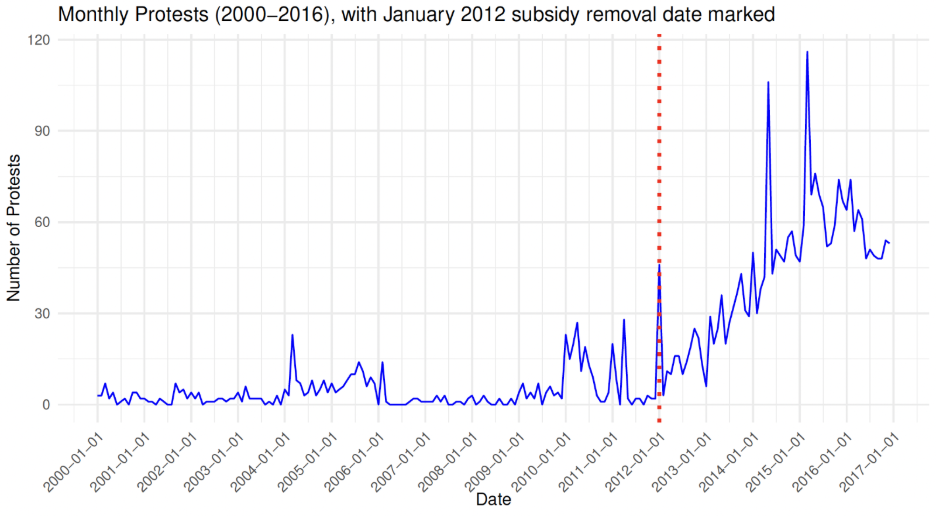
Because the subsidy was removed nationwide on a single day, the states that experienced sudden increases in protest activity and those that stayed comparatively quiet differed not in their local circumstances, but only in how intensely they reacted to a common shock – namely, the subsidy removal. We compare how VAT transfers changed after January 2012 in heavily protesting states relative to less protesting states using a difference-in-differences approach that nets out national trends affecting all states similarly. An event study tracing the transfer gap between these states month by month confirms they followed parallel trends beforehand, and that the divergence afterwards reflects the effect of the protests rather than pre-existing differences (Figure 2). The evidence confirms that politically aligned states received more VAT transfers during the protests while non-aligned states received less.
Figure 2: How VAT transfers responded to protests around the January 2012 fuel subsidy removal
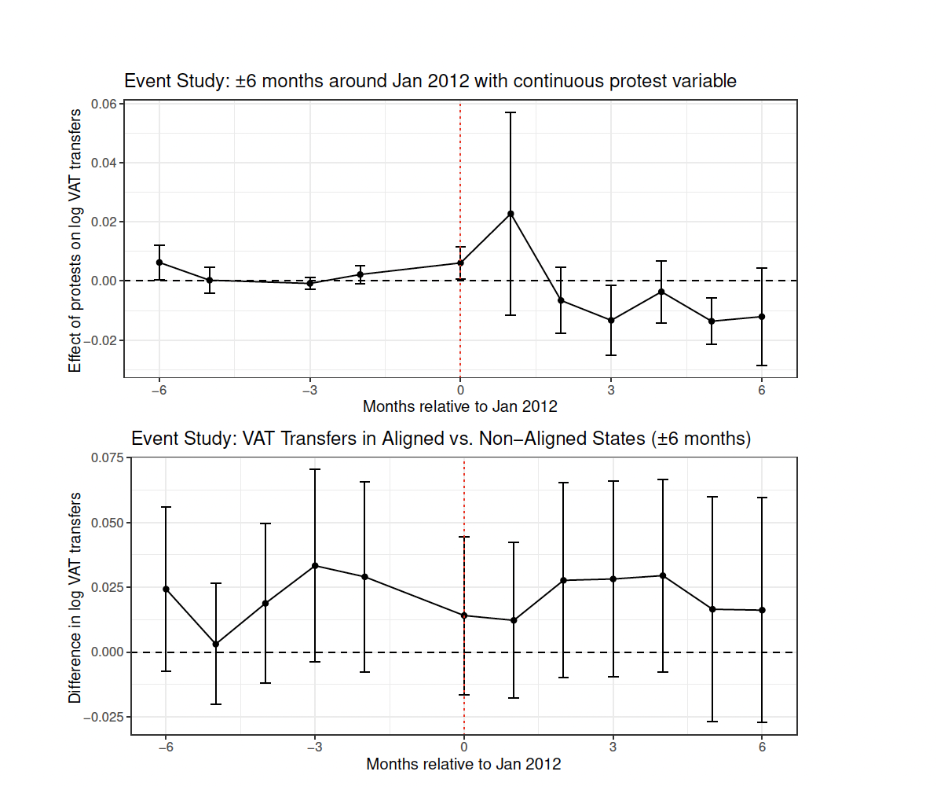
Notes: Each point shows the estimated effect in each month relative to January 2012 (month 0) with vertical bars showing the range of uncertainty. Top panel: the effect of protest intensity on VAT transfers. Bottom panel: the gap in VAT transfers between politically aligned and non-aligned states. The near-zero values before January 2012 show that higher and lower protest activity states were following similar paths beforehand, so the changes afterward can be attributed to the protests.
Nigeria’s 2015 presidential election offers a second natural experiment. When the opposition defeated the incumbent president for the first time in the country’s history, 23 of 36 states simultaneously switched political alignment – some states that had been aligned with the federal government suddenly were not, and others that had not been aligned suddenly were. This allows us to apply the same difference-in-differences logic to alignment itself: we compare how protest-driven transfers changed for states that gained alignments against states that lost alignment or never switched, before versus after the election. Because the election flipped 23 states’ alignment at once for reasons rooted in national coalition politics rather than any single state’s conditions, the comparison isolates the effect of the political relationship rather than fixed state characteristics. We find that states that became aligned after the election began receiving more VAT transfers when protests occurred (Figure 3), while states that lost alignment did not. This confirms that the fiscal response follows the political relationship between state and federal governments rather than fixed state characteristics such as size or geography. This channel is specific to opaque VAT transfers: the federal government can adjust these transfers without public scrutiny but faces political costs for visibly manipulating the more heavily scrutinized allocation transfers.
Figure 3: Protests, state political alignment and yearly VAT transfers (top panel) and allocation transfers (bottom panel) in 2015; full sample (left) and sample excluding Lagos (right) shown
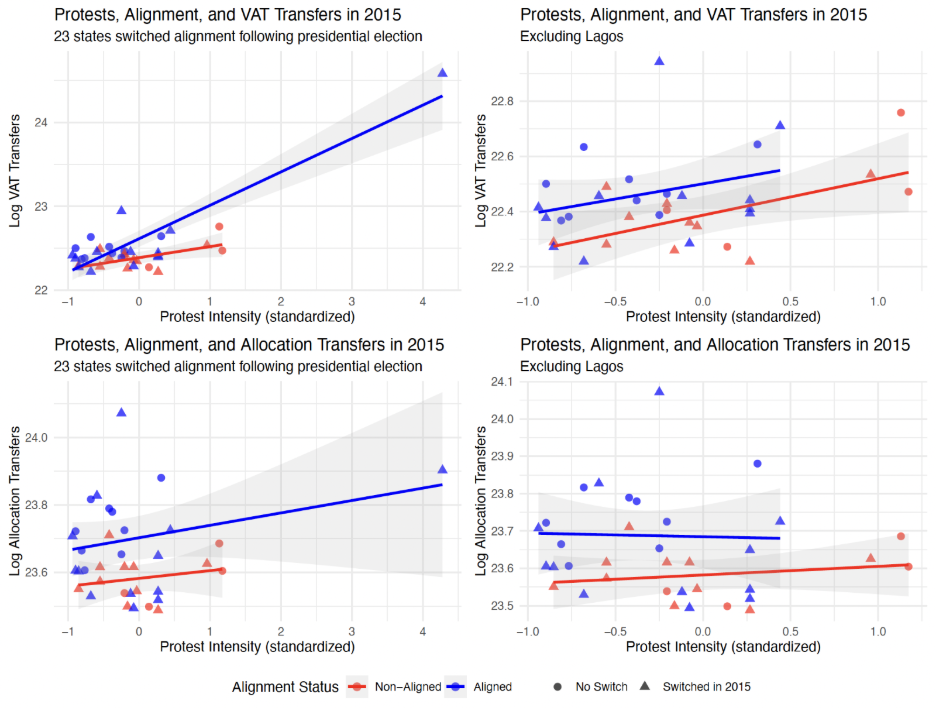
Notes: Relationship between protest intensity and transfers by political alignment status; blue and red show aligned and non-aligned states, respectively. Triangles mark 23 states that switched alignment when the opposition party (APC) defeated the ruling PDP in the 2015 election; circles mark states that did not switch political alignment. Lines show fitted linear relationships with 95% confidence intervals (shaded regions). Y-axis scales differ across columns to improve readability; the full sample range is wider due to Lagos.
Protest effects extend beyond transfers to government spending priorities and security responses
The fiscal response to protests extends beyond transfer levels to states’ budget composition. The effects of protests on increasing transfers in politically aligned states persist up to two years; aligned state governments strategically reallocate their budgets in response to protests and initially expand recurrent expenditure – concentrated in pension transfers to organised public sector workers – before shifting to capital spending that prioritises visible infrastructure investment (Figure 4). This pattern is consistent with governments first addressing immediate organised labour grievances, then shifting towards visible development projects that signal fiscal responsiveness to the broader population.
Figure 4: How protest effects on government finances evolve over time in politically aligned states
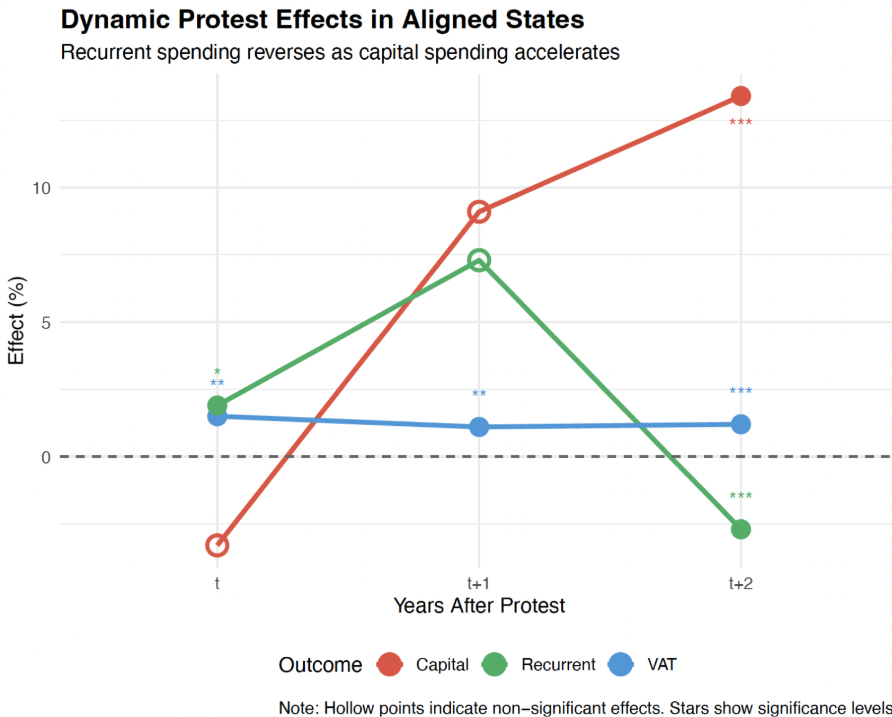
Notes: Net effects of protests on VAT transfers, recurrent expenditure, and capital expenditure in politically aligned states over three years. Positive values indicate that higher protest intensity is associated with increases in the outcome in aligned states; negative values indicate decreases. Filled points indicate statistically significant effects; hollow points are non-significant effects.
Protests also trigger increased policing and police violence against protesters, particularly in politically non-aligned states. Protests result in increased police violence in non-aligned states but fiscal transfers in politically aligned states, consistent with the federal government choosing between coercion and fiscal concession based on the political relationship with protesting regions.
Why protests matters for policy
These findings have implications for how we think about citizen mobilisation as a mechanism for fiscal accountability. Protest effectiveness as a tool for extracting fiscal concessions depends on political alignment. Protests in politically aligned regions may attract fiscal concessions while protests in non-aligned regions may be more likely to generate repression than redistribution. Recent evidence from the US suggests this mechanism extends beyond Nigeria: during the October 2025 US government shutdown, the Trump administration froze nearly $28 billion in federal aid predominantly targeting Democratic-led cities and districts engaged in protests against the administration's immigration policies (Romm and Gamio 2025), consistent with the narrative that politically non-aligned protesting regions face fiscal punishment rather than concession.
Policy reforms that increase the transparency of fiscal transfers and distribution – for instance, through public disclosure of state-level receipts and formula inputs – could reduce the scope for alignment-contingent fiscal adjustment and make intergovernmental transfers more responsive to citizen needs rather than political relationships.
References
Adebayo, K O (2015), "Occupy Nigeria Movement, organized labor unions, and oil-subsidy struggle," Social Media and Social Movements: The Transformation of Communication Patterns, 37.
Adeloye, D, R A David, A A Olaogun, A Auta, A Adesokan, M Gadanya, J K Opele, O Owagbemi, and A Iseolorunkanmi (2017), "Health workforce and governance: The crisis in Nigeria," Human Resources for Health, 15(1): 1–8.
Akanle, O, K Adebayo, and O Adetayo (2014), "Fuel subsidy in Nigeria: Contexts of governance and social protest," International Journal of Sociology and Social Policy.
Archibong, B, C Okafor, E S Osabuohien, and T Moerenhout (2026), "Protest matters: The effects of protests on economic redistribution," NBER Working Paper No. 34787.
Maystadt, J-F, and M-K Salihu (2019), "National or political cake? The political economy of intergovernmental transfers in Nigeria," Journal of Economic Geography, 19(5): 1119–1142.
Orifowomo, O A (2006), "A critical appraisal of pension system reforms in Nigeria," Gonzaga Journal of International Law, 10: 164.
Romm, T, and L Gamio (2025), "Trump targets Democratic districts by halting billions during shutdown," The New York Times.