

Although most Mexicans remained in their communities during the drug war, the associated violence generated large welfare losses that are mostly invisible in standard migration statistics.
Editor’s note: This column is published in collaboration with the International Economic Association’s Women in Leadership in Economics initiative, which aims to enhance the role of women in economics through research, building partnerships, and amplifying voices. For a broader synthesis of themes covered in this article, check out our VoxDevLit on Organised Crime. The author has made slides available here.
Why internal mobility matters for development
Internal mobility is a central mechanism through which individuals can respond to local shocks. Workers relocate when safety deteriorates, local labour markets weaken, or opportunities elsewhere become relatively more attractive. However, as Bryan and Morten (2019) find in an Indonesian context, even modest migration frictions can prevent workers from accessing productivity gains. Internal migration is rarely costless, and these frictions might shape how societies absorb shocks.
While geographic mobility could, in principle, help absorb regional shocks, in much of Latin America it remains constrained by high mobility costs and institutional frictions, thereby limiting adjustment to economic and security shocks (Artuç et al. 2015, Dix-Carneiro and Kovak 2017). Mexico’s experience during the escalation of violence in the late 2000s offers a compelling test case. The country experienced an abrupt, severe, and highly uneven increase in homicides starting in 2007, as conflict between drug trafficking organisations intensified. If violence drives people away, we might expect large-scale population movements from affected areas. Instead, we observe a more complex pattern: limited long-distance migration, substantial reallocation within local labour markets, and significant welfare losses for those who remain.
Our research (Aldeco Leo, Jurado, and Ramírez-Álvarez 2024) focuses on internal migration and welfare during the escalation of violence in Mexico in the late 2000s. We show that violence reshaped internal migration patterns, but not through mass displacement. Instead, violence altered who moves, where they go, and who decides not to move at all.
Mexico’s homicide shock: A natural experiment in uneven violence
Between 2007 and 2011, the national homicide rate nearly tripled. But this violence was far from uniform. Some municipalities faced extreme surges in homicides, public shootouts, executions in open spaces, and visible conflict, while others, sometimes within the same commuting region, remained comparatively safe.
This spatial heterogeneity is crucial for understanding migration responses. It allows us to compare places that share labour markets and commuting patterns but experienced markedly different levels of violence.
The spatial pattern of violence shown in Figure 1 serves as the empirical foundation for our analysis. We study migration dynamics using population data from the 2000, 2010, and 2015 censuses and intercensal surveys, which allow us to observe where individuals lived five years before. We group municipalities into empirically defined commuting zones and distinguish between short-distance moves within a labour market and long-distance moves across regions. Making this distinction is important because migration costs and responses differ sharply by distance.
Figure 1: Log homicide rates by municipality, 2010
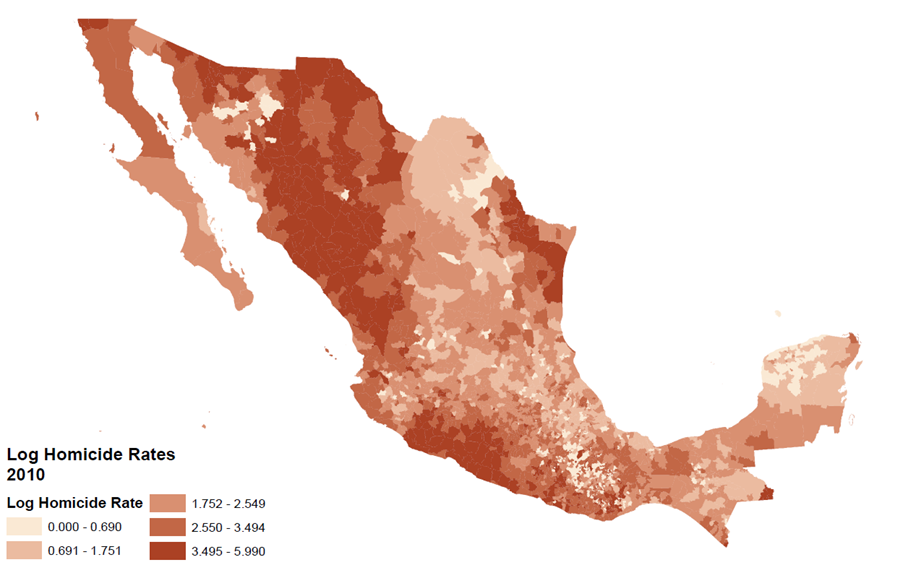
Note: This map shows log homicide rates across Mexican municipalities in 2010. Source: Authors’ calculations using data from INEGI (homicides) and CONAPO (population).
How do we identify the causal effects of violence?
Violence is not exogenous. It can correlate with weak institutional capacity, declining local labour markets, or pre-existing migration trends. To overcome this challenge, we construct an instrumental variable that exploits predicted inter-cartel conflict along drug-trafficking routes.
We combine three elements:
- Origins of marijuana and poppy production, defined as municipalities in the top 5% of eradicated area over the study period, which together account for 95% of poppy and 85% of marijuana eradication.
- DEA conflict maps, which reveal cartel presence and influence at US border entry points.
- Shifts in cartel alliances (generally caused by conflict and agreements among high-level cartel members) as documented by journalistic sources and law enforcement analyses.
For each alliance year, we identify the shortest feasible highway routes connecting drug origins with border crossings controlled by the same drug trafficking organisation. When these modelled routes from different alliances cross a municipality in a given year, we classify that municipality as experiencing predicted conflict.
Figure 2 helps illustrate how the overlap of cartel routes generates exogenous variation in homicide exposure.
Figure 2: Marijuana route examples in 2010 and the log homicide rate in 2010
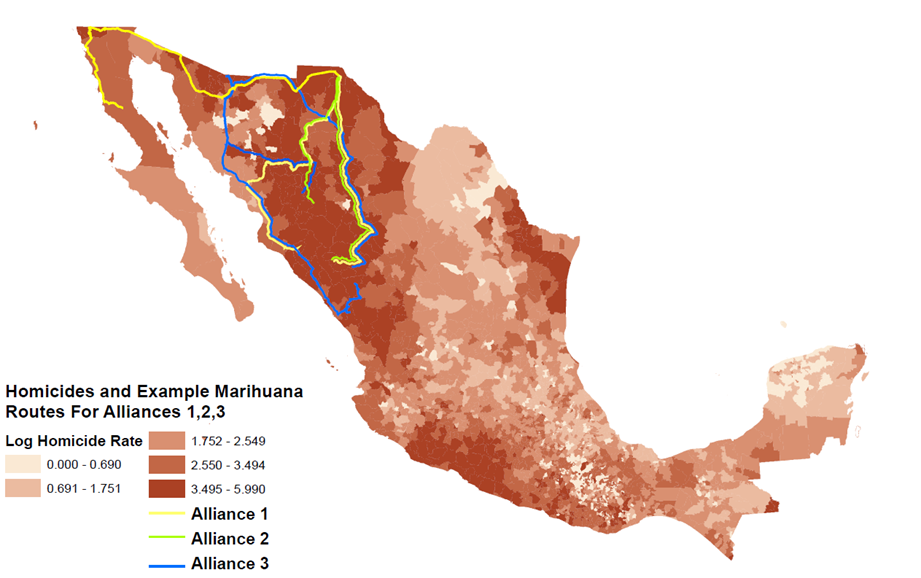
Note: This figure shows the predicted network of routes operated by alliances 1 and 2, along with the logarithm of the homicide rate. Source: Authors’ own estimation based on information from INEGI, CONAPO, and Drug Enforcement Administration (2020).
We complement this with a second instrument based on the cocaine-scarcity measure proposed by Castillo et al. (2020), which interacts cocaine seizures in Colombia with distance to the US border. Together, these instruments provide sharp and plausibly exogenous predictors of local violence.
What rises in homicides actually do: Not a displacement crisis, but a distortion
1. People move away, but they stay close.
A striking finding is that increased violence leads to out-migration exclusively through short-distance moves within commuting zones, with no detectable response in longer-distance migration. A 1% increase in the homicide rate raises migration flows to other municipalities within the same local labour market by 0.32–0.48%. These moves are costly, but substantially less expensive than relocating across regions.
Figure 3 shows that a large share of migration occurs over short distances, often within the same commuting zone, likely reflecting lower costs and frictions. Moreover, the bimodal distribution of migration distances suggests the need to distinguish between local and longer-range moves in the analysis.
Figure 3: Log distance moved, by skill, 2000–2015
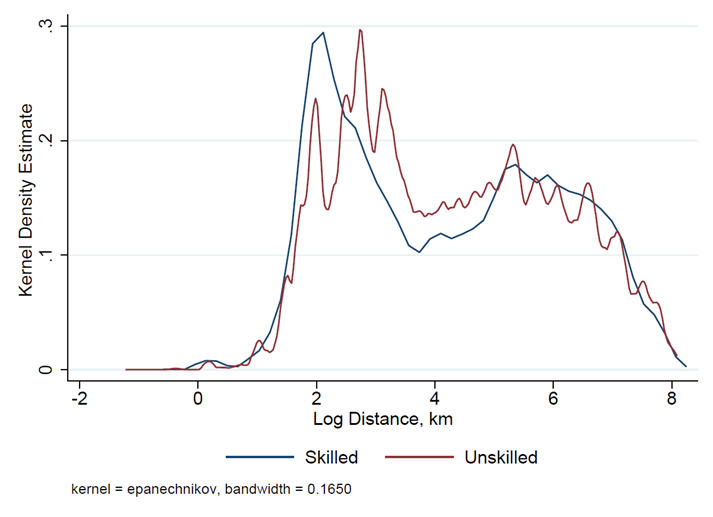
Note: This figure shows the estimated densities of log kilometres between origins and destinations, for all migration events in the study period, by skill level. Source: Authors’ own estimation based on information from INEGI.
2. Violence deters skilled immigration
We find no evidence of large-scale outflows of skilled workers from violent municipalities. Instead, skilled individuals respond by avoiding violent places: they choose not to move into them. A 1% increase in homicides significantly reduces skilled inflows from outside the commuting zone by around 0.16%.
Why people don’t move far: The role of migration costs
The muted displacement response does not mean violence had minor effects. But it reflects the enormous economic, social, and institutional costs of moving across regions in Mexico.
To quantify these frictions, we estimate a Diamond-style discrete-choice spatial equilibrium model in which individuals choose municipalities based on wages, amenities, and migration costs. The model incorporates both within- and across-commuting-zone moves, allowing us to capture both types of frictions.
Our findings are as follows:
- The model implies that the costs of relocation, especially across commuting zones, are substantial relative to the utility effects of incremental increases in local violence.
- Individuals are willing to sacrifice wages to avoid violence:
- Skilled: 0.29–0.58% of monthly wages per 1% reduction in homicide rates
- Unskilled: 0.13–0.18% of monthly wages per 1% reduction in homicide rates
These values highlight a strong aversion to violence and the considerable constraints that prevent people from relocating farther.
The invisible welfare cost of Mexico’s drug violence
The welfare cost of the post-2007 increase in homicides is on the order of 10% of GDP annually. Importantly, these losses do not result from the migration of millions of people. Instead, they are borne primarily by non-movers, who endure deteriorated amenities without relocating. Our estimates are consistent with those from Colombia, where Rozo (2018) finds that decreases in homicides yield gains of a similar order of magnitude.
Figure 4: Willingness to pay to reduce homicide rates
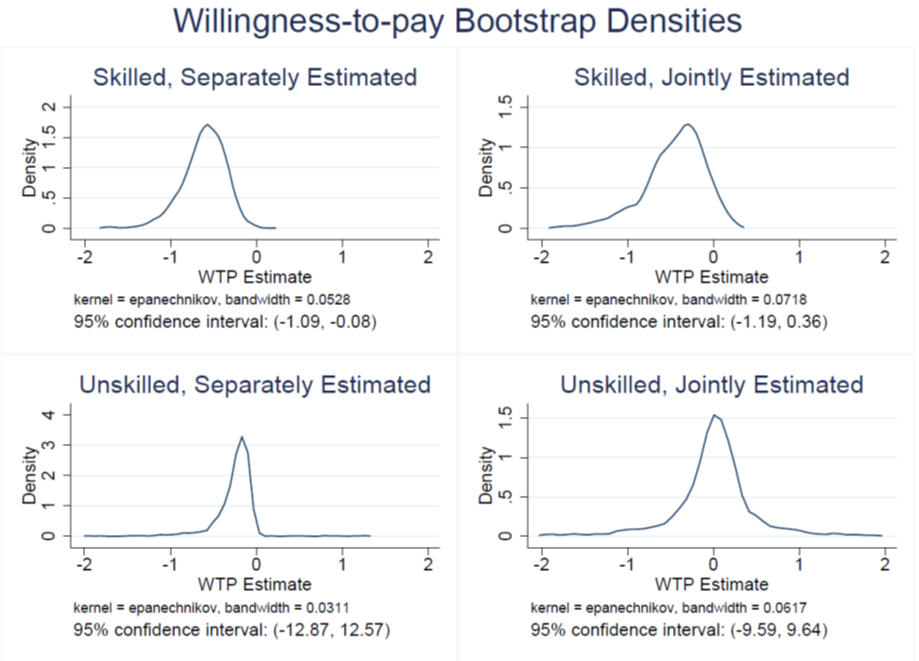
Note: This figure shows the bootstrap densities of the willingness-to-pay estimates by skill level and for separate and joint computations of the underlying utility coefficients. For the separate computation, utility coefficients were obtained from separate IV regressions of mean utility on endogenous log homicide rates and wages, using our constructed routes and 1999 sector shares interacted with years as instruments. In the joint case, both coefficients were obtained in the same regression. 10,000-bootstrapped sample with replacement was used. Source: Authors’ own estimation based on information from INEGI.
Implications for policy: Migration and violence
- Violence reduction is itself a development policy. Improving security expands people’s real choices and improves welfare, even when we do not observe large migration flows. The absence of mass displacement should not be interpreted as resilience. Many individuals remain in violent places because the costs of moving are simply too high. As a result, the welfare costs of violence are often invisible in standard migration statistics.
- Violence reshapes local economies by deterring skilled workers from moving in. While we find no evidence of large-scale outflows of skilled workers in violent municipalities, they attract fewer skilled migrants from elsewhere. Over time, this may lead to lower local productivity and slower human capital accumulation.
- Mobility barriers play a key role in shaping these outcomes. The high cost of relocation, especially across regions, limits households’ ability to respond to shocks, even when the welfare gains from moving are substantial. Policies that lower these costs, such as expanding rental markets, improving transport integration, or reducing administrative barriers, can enhance resilience to future shocks.
- Focusing only on displacement risks understates the true social cost of violence. Our results show that most welfare losses are borne by individuals who do not move, but instead endure worsening local conditions. This suggests that policy responses to violence should not focus exclusively on displaced populations or on facilitating mobility. Supporting those who remain in place is equally central to mitigating the welfare costs of violence. Accounting for these ‘immobile’ losses is essential for understanding the full economic consequences of insecurity.
References
Aldeco Leo, L, A Jurado, and A A Ramírez-Álvarez (2024), “Internal migration and drug violence in Mexico,” Journal of Development Economics, 171: 103334.
Artuç, E, D Lederman, and G Porto (2015), “A mapping of labor mobility costs in the developing world,” Journal of International Economics, 95: 28–41.
Bryan, G, and M Morten (2019), “The aggregate productivity effects of internal migration: Evidence from Indonesia,” Journal of Political Economy, 127: 2229–2268.
Castillo, J C, D Mejía, and P Restrepo (2020), “Scarcity without leviathan: The violent effects of cocaine supply shortages in the Mexican Drug War,” Review of Economics and Statistics, 102: 269–286.
Dix-Carneiro, R, and B Kovak (2017), “Trade liberalization and regional dynamics,” American Economic Review, 107: 2908–2946.
Rozo, S (2018), “Is murder bad for business? Evidence from Colombia,” Review of Economics and Statistics, 100: 769–782.